Sri Lankan vs Croatian Householder Income Ages 25 - 44 years
COMPARE
Sri Lankan
Croatian
Householder Income Ages 25 - 44 years
Householder Income Ages 25 - 44 years Comparison
Sri Lankans
Croatians
$101,960
HOUSEHOLDER INCOME AGES 25 - 44 YEARS
98.4/ 100
METRIC RATING
94th/ 347
METRIC RANK
$102,414
HOUSEHOLDER INCOME AGES 25 - 44 YEARS
98.7/ 100
METRIC RATING
91st/ 347
METRIC RANK
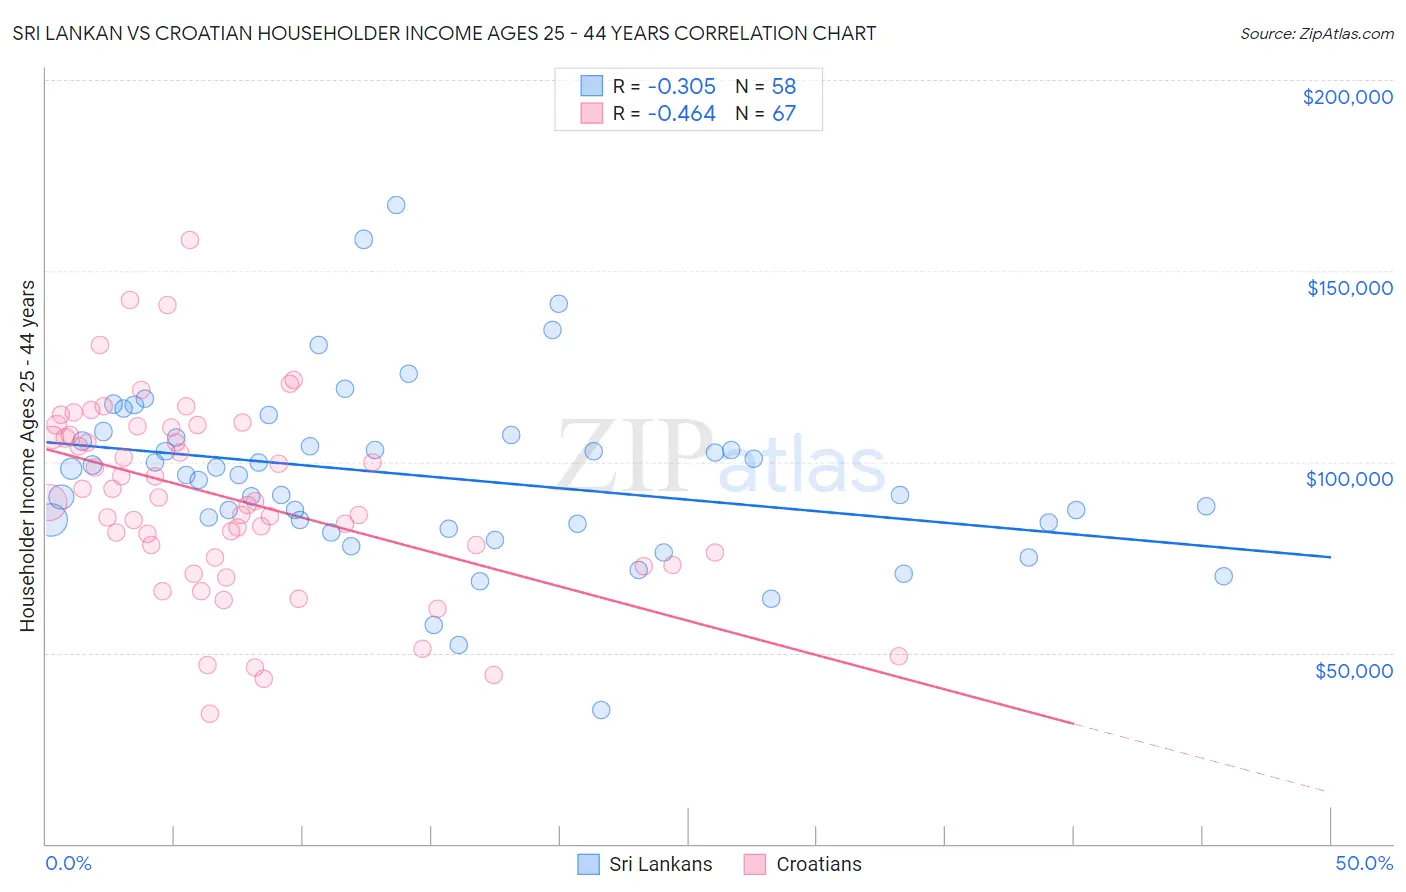
Sri Lankan vs Croatian Householder Income Ages 25 - 44 years Correlation Chart
The statistical analysis conducted on geographies consisting of 439,036,637 people shows a mild negative correlation between the proportion of Sri Lankans and household income with householder between the ages 25 and 44 in the United States with a correlation coefficient (R) of -0.305 and weighted average of $101,960. Similarly, the statistical analysis conducted on geographies consisting of 374,641,532 people shows a moderate negative correlation between the proportion of Croatians and household income with householder between the ages 25 and 44 in the United States with a correlation coefficient (R) of -0.464 and weighted average of $102,414, a difference of 0.45%.
Householder Income Ages 25 - 44 years Correlation Summary
| Measurement | Sri Lankan | Croatian |
| Minimum | $35,156 | $33,958 |
| Maximum | $167,132 | $158,158 |
| Range | $131,976 | $124,200 |
| Mean | $96,155 | $90,676 |
| Median | $96,605 | $89,581 |
| Interquartile 25% (IQ1) | $83,833 | $75,000 |
| Interquartile 75% (IQ3) | $106,327 | $109,113 |
| Interquartile Range (IQR) | $22,494 | $34,113 |
| Standard Deviation (Sample) | $23,383 | $25,045 |
| Standard Deviation (Population) | $23,180 | $24,857 |
Demographics Similar to Sri Lankans and Croatians by Householder Income Ages 25 - 44 years
In terms of householder income ages 25 - 44 years, the demographic groups most similar to Sri Lankans are Assyrian/Chaldean/Syriac ($101,936, a difference of 0.020%), Immigrants from England ($102,020, a difference of 0.060%), Macedonian ($101,882, a difference of 0.080%), Austrian ($101,842, a difference of 0.12%), and Immigrants from Kazakhstan ($101,727, a difference of 0.23%). Similarly, the demographic groups most similar to Croatians are Immigrants from North America ($102,407, a difference of 0.010%), Ukrainian ($102,451, a difference of 0.040%), Romanian ($102,544, a difference of 0.13%), Immigrants from Canada ($102,616, a difference of 0.20%), and Immigrants from Western Europe ($102,654, a difference of 0.23%).
| Demographics | Rating | Rank | Householder Income Ages 25 - 44 years |
| Immigrants | Serbia | 99.2 /100 | #82 | Exceptional $103,155 |
| Argentineans | 99.1 /100 | #83 | Exceptional $103,111 |
| Immigrants | Philippines | 99.0 /100 | #84 | Exceptional $102,910 |
| Immigrants | Ukraine | 98.9 /100 | #85 | Exceptional $102,664 |
| Immigrants | Hungary | 98.9 /100 | #86 | Exceptional $102,655 |
| Immigrants | Western Europe | 98.9 /100 | #87 | Exceptional $102,654 |
| Immigrants | Canada | 98.9 /100 | #88 | Exceptional $102,616 |
| Romanians | 98.8 /100 | #89 | Exceptional $102,544 |
| Ukrainians | 98.8 /100 | #90 | Exceptional $102,451 |
| Croatians | 98.7 /100 | #91 | Exceptional $102,414 |
| Immigrants | North America | 98.7 /100 | #92 | Exceptional $102,407 |
| Immigrants | England | 98.4 /100 | #93 | Exceptional $102,020 |
| Sri Lankans | 98.4 /100 | #94 | Exceptional $101,960 |
| Assyrians/Chaldeans/Syriacs | 98.3 /100 | #95 | Exceptional $101,936 |
| Macedonians | 98.3 /100 | #96 | Exceptional $101,882 |
| Austrians | 98.3 /100 | #97 | Exceptional $101,842 |
| Immigrants | Kazakhstan | 98.1 /100 | #98 | Exceptional $101,727 |
| Taiwanese | 97.9 /100 | #99 | Exceptional $101,492 |
| Immigrants | Argentina | 97.8 /100 | #100 | Exceptional $101,415 |
| Albanians | 97.8 /100 | #101 | Exceptional $101,367 |
| Immigrants | Lebanon | 97.4 /100 | #102 | Exceptional $101,124 |