Immigrants from Armenia vs Croatian Householder Income Ages 25 - 44 years
COMPARE
Immigrants from Armenia
Croatian
Householder Income Ages 25 - 44 years
Householder Income Ages 25 - 44 years Comparison
Immigrants from Armenia
Croatians
$94,867
HOUSEHOLDER INCOME AGES 25 - 44 YEARS
54.2/ 100
METRIC RATING
171st/ 347
METRIC RANK
$102,414
HOUSEHOLDER INCOME AGES 25 - 44 YEARS
98.7/ 100
METRIC RATING
91st/ 347
METRIC RANK
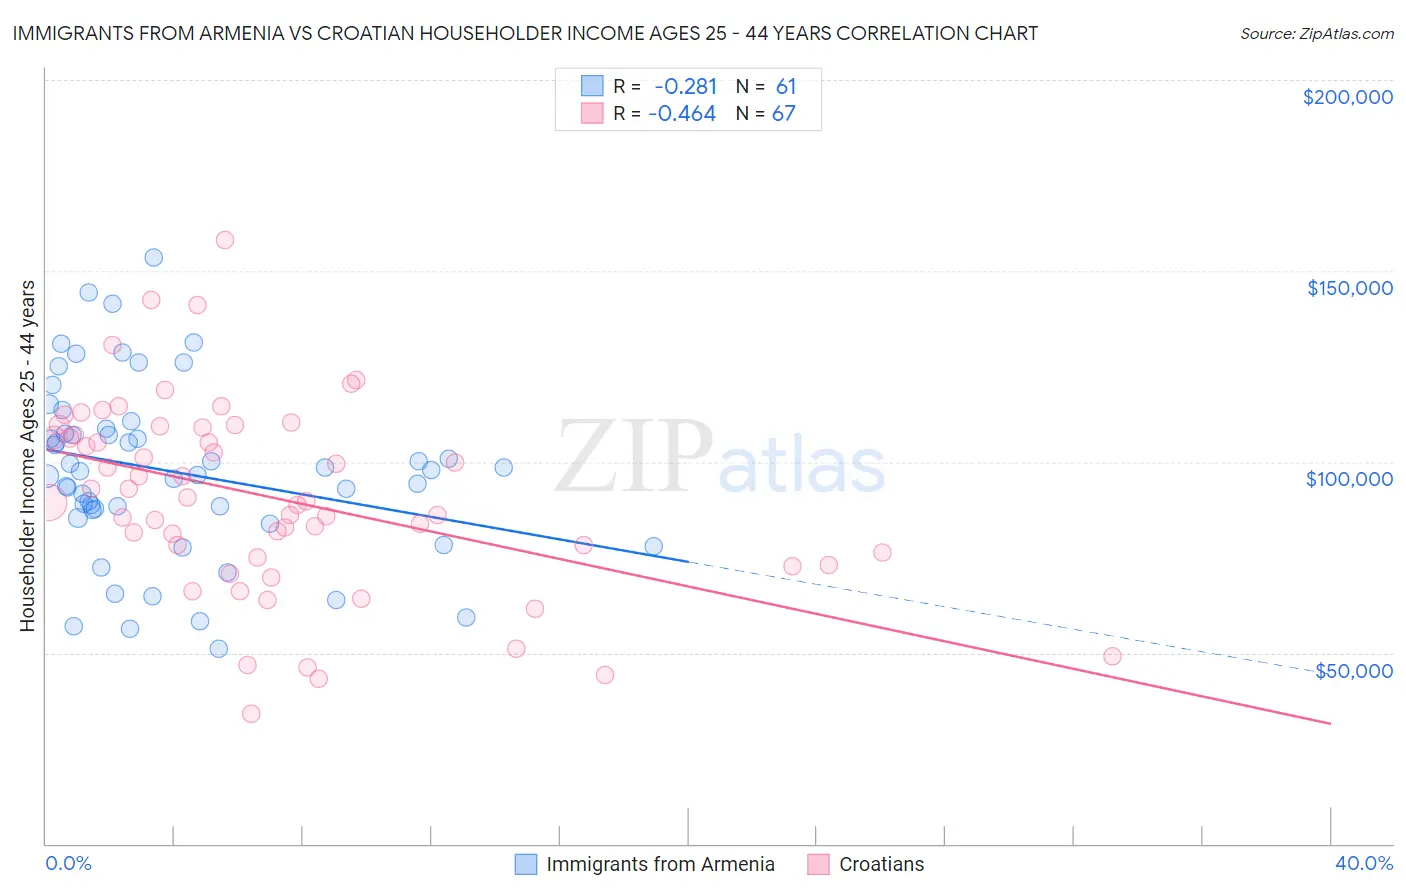
Immigrants from Armenia vs Croatian Householder Income Ages 25 - 44 years Correlation Chart
The statistical analysis conducted on geographies consisting of 97,704,763 people shows a weak negative correlation between the proportion of Immigrants from Armenia and household income with householder between the ages 25 and 44 in the United States with a correlation coefficient (R) of -0.281 and weighted average of $94,867. Similarly, the statistical analysis conducted on geographies consisting of 374,641,532 people shows a moderate negative correlation between the proportion of Croatians and household income with householder between the ages 25 and 44 in the United States with a correlation coefficient (R) of -0.464 and weighted average of $102,414, a difference of 8.0%.
Householder Income Ages 25 - 44 years Correlation Summary
| Measurement | Immigrants from Armenia | Croatian |
| Minimum | $50,938 | $33,958 |
| Maximum | $153,486 | $158,158 |
| Range | $102,548 | $124,200 |
| Mean | $97,387 | $90,676 |
| Median | $97,643 | $89,581 |
| Interquartile 25% (IQ1) | $86,360 | $75,000 |
| Interquartile 75% (IQ3) | $108,002 | $109,113 |
| Interquartile Range (IQR) | $21,642 | $34,113 |
| Standard Deviation (Sample) | $22,751 | $25,045 |
| Standard Deviation (Population) | $22,564 | $24,857 |
Similar Demographics by Householder Income Ages 25 - 44 years
Demographics Similar to Immigrants from Armenia by Householder Income Ages 25 - 44 years
In terms of householder income ages 25 - 44 years, the demographic groups most similar to Immigrants from Armenia are Slovak ($95,032, a difference of 0.17%), Alsatian ($95,059, a difference of 0.20%), Native Hawaiian ($95,058, a difference of 0.20%), Czechoslovakian ($95,070, a difference of 0.21%), and Scottish ($94,622, a difference of 0.26%).
| Demographics | Rating | Rank | Householder Income Ages 25 - 44 years |
| South Americans | 60.9 /100 | #164 | Good $95,362 |
| Immigrants | Nepal | 60.3 /100 | #165 | Good $95,322 |
| Immigrants | Ethiopia | 59.5 /100 | #166 | Average $95,256 |
| Czechoslovakians | 57.0 /100 | #167 | Average $95,070 |
| Alsatians | 56.8 /100 | #168 | Average $95,059 |
| Native Hawaiians | 56.8 /100 | #169 | Average $95,058 |
| Slovaks | 56.4 /100 | #170 | Average $95,032 |
| Immigrants | Armenia | 54.2 /100 | #171 | Average $94,867 |
| Scottish | 50.8 /100 | #172 | Average $94,622 |
| Finns | 50.6 /100 | #173 | Average $94,610 |
| Colombians | 50.0 /100 | #174 | Average $94,565 |
| English | 48.1 /100 | #175 | Average $94,429 |
| Immigrants | Immigrants | 48.0 /100 | #176 | Average $94,423 |
| Belgians | 45.8 /100 | #177 | Average $94,262 |
| Immigrants | South America | 42.8 /100 | #178 | Average $94,042 |
Demographics Similar to Croatians by Householder Income Ages 25 - 44 years
In terms of householder income ages 25 - 44 years, the demographic groups most similar to Croatians are Immigrants from North America ($102,407, a difference of 0.010%), Ukrainian ($102,451, a difference of 0.040%), Romanian ($102,544, a difference of 0.13%), Immigrants from Canada ($102,616, a difference of 0.20%), and Immigrants from Western Europe ($102,654, a difference of 0.23%).
| Demographics | Rating | Rank | Householder Income Ages 25 - 44 years |
| Immigrants | Philippines | 99.0 /100 | #84 | Exceptional $102,910 |
| Immigrants | Ukraine | 98.9 /100 | #85 | Exceptional $102,664 |
| Immigrants | Hungary | 98.9 /100 | #86 | Exceptional $102,655 |
| Immigrants | Western Europe | 98.9 /100 | #87 | Exceptional $102,654 |
| Immigrants | Canada | 98.9 /100 | #88 | Exceptional $102,616 |
| Romanians | 98.8 /100 | #89 | Exceptional $102,544 |
| Ukrainians | 98.8 /100 | #90 | Exceptional $102,451 |
| Croatians | 98.7 /100 | #91 | Exceptional $102,414 |
| Immigrants | North America | 98.7 /100 | #92 | Exceptional $102,407 |
| Immigrants | England | 98.4 /100 | #93 | Exceptional $102,020 |
| Sri Lankans | 98.4 /100 | #94 | Exceptional $101,960 |
| Assyrians/Chaldeans/Syriacs | 98.3 /100 | #95 | Exceptional $101,936 |
| Macedonians | 98.3 /100 | #96 | Exceptional $101,882 |
| Austrians | 98.3 /100 | #97 | Exceptional $101,842 |
| Immigrants | Kazakhstan | 98.1 /100 | #98 | Exceptional $101,727 |