Latvian vs Croatian Householder Income Ages 25 - 44 years
COMPARE
Latvian
Croatian
Householder Income Ages 25 - 44 years
Householder Income Ages 25 - 44 years Comparison
Latvians
Croatians
$108,926
HOUSEHOLDER INCOME AGES 25 - 44 YEARS
100.0/ 100
METRIC RATING
36th/ 347
METRIC RANK
$102,414
HOUSEHOLDER INCOME AGES 25 - 44 YEARS
98.7/ 100
METRIC RATING
91st/ 347
METRIC RANK
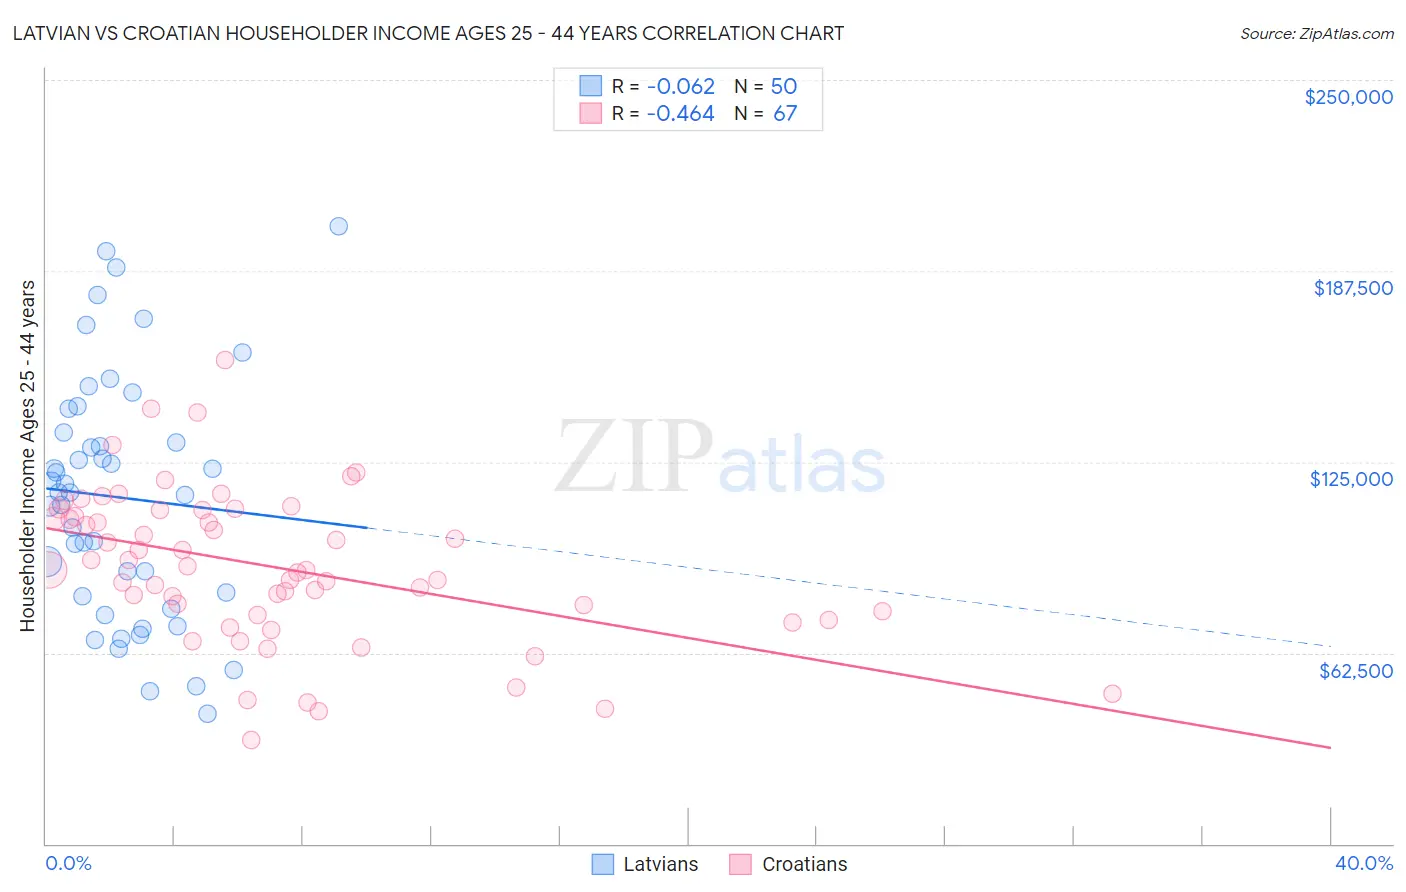
Latvian vs Croatian Householder Income Ages 25 - 44 years Correlation Chart
The statistical analysis conducted on geographies consisting of 220,250,267 people shows a slight negative correlation between the proportion of Latvians and household income with householder between the ages 25 and 44 in the United States with a correlation coefficient (R) of -0.062 and weighted average of $108,926. Similarly, the statistical analysis conducted on geographies consisting of 374,641,532 people shows a moderate negative correlation between the proportion of Croatians and household income with householder between the ages 25 and 44 in the United States with a correlation coefficient (R) of -0.464 and weighted average of $102,414, a difference of 6.4%.
Householder Income Ages 25 - 44 years Correlation Summary
| Measurement | Latvian | Croatian |
| Minimum | $42,679 | $33,958 |
| Maximum | $202,188 | $158,158 |
| Range | $159,509 | $124,200 |
| Mean | $113,340 | $90,676 |
| Median | $114,915 | $89,581 |
| Interquartile 25% (IQ1) | $80,877 | $75,000 |
| Interquartile 75% (IQ3) | $134,488 | $109,113 |
| Interquartile Range (IQR) | $53,611 | $34,113 |
| Standard Deviation (Sample) | $39,584 | $25,045 |
| Standard Deviation (Population) | $39,186 | $24,857 |
Similar Demographics by Householder Income Ages 25 - 44 years
Demographics Similar to Latvians by Householder Income Ages 25 - 44 years
In terms of householder income ages 25 - 44 years, the demographic groups most similar to Latvians are Immigrants from Russia ($108,751, a difference of 0.16%), Immigrants from Switzerland ($109,185, a difference of 0.24%), Bolivian ($109,372, a difference of 0.41%), Soviet Union ($108,457, a difference of 0.43%), and Bhutanese ($109,520, a difference of 0.55%).
| Demographics | Rating | Rank | Householder Income Ages 25 - 44 years |
| Turks | 100.0 /100 | #29 | Exceptional $110,318 |
| Immigrants | Greece | 100.0 /100 | #30 | Exceptional $110,103 |
| Maltese | 100.0 /100 | #31 | Exceptional $110,064 |
| Immigrants | Sri Lanka | 100.0 /100 | #32 | Exceptional $109,741 |
| Bhutanese | 100.0 /100 | #33 | Exceptional $109,520 |
| Bolivians | 100.0 /100 | #34 | Exceptional $109,372 |
| Immigrants | Switzerland | 100.0 /100 | #35 | Exceptional $109,185 |
| Latvians | 100.0 /100 | #36 | Exceptional $108,926 |
| Immigrants | Russia | 100.0 /100 | #37 | Exceptional $108,751 |
| Soviet Union | 100.0 /100 | #38 | Exceptional $108,457 |
| Immigrants | France | 99.9 /100 | #39 | Exceptional $108,257 |
| Immigrants | Lithuania | 99.9 /100 | #40 | Exceptional $108,149 |
| Immigrants | Bolivia | 99.9 /100 | #41 | Exceptional $108,128 |
| Australians | 99.9 /100 | #42 | Exceptional $107,912 |
| Immigrants | Malaysia | 99.9 /100 | #43 | Exceptional $107,650 |
Demographics Similar to Croatians by Householder Income Ages 25 - 44 years
In terms of householder income ages 25 - 44 years, the demographic groups most similar to Croatians are Immigrants from North America ($102,407, a difference of 0.010%), Ukrainian ($102,451, a difference of 0.040%), Romanian ($102,544, a difference of 0.13%), Immigrants from Canada ($102,616, a difference of 0.20%), and Immigrants from Western Europe ($102,654, a difference of 0.23%).
| Demographics | Rating | Rank | Householder Income Ages 25 - 44 years |
| Immigrants | Philippines | 99.0 /100 | #84 | Exceptional $102,910 |
| Immigrants | Ukraine | 98.9 /100 | #85 | Exceptional $102,664 |
| Immigrants | Hungary | 98.9 /100 | #86 | Exceptional $102,655 |
| Immigrants | Western Europe | 98.9 /100 | #87 | Exceptional $102,654 |
| Immigrants | Canada | 98.9 /100 | #88 | Exceptional $102,616 |
| Romanians | 98.8 /100 | #89 | Exceptional $102,544 |
| Ukrainians | 98.8 /100 | #90 | Exceptional $102,451 |
| Croatians | 98.7 /100 | #91 | Exceptional $102,414 |
| Immigrants | North America | 98.7 /100 | #92 | Exceptional $102,407 |
| Immigrants | England | 98.4 /100 | #93 | Exceptional $102,020 |
| Sri Lankans | 98.4 /100 | #94 | Exceptional $101,960 |
| Assyrians/Chaldeans/Syriacs | 98.3 /100 | #95 | Exceptional $101,936 |
| Macedonians | 98.3 /100 | #96 | Exceptional $101,882 |
| Austrians | 98.3 /100 | #97 | Exceptional $101,842 |
| Immigrants | Kazakhstan | 98.1 /100 | #98 | Exceptional $101,727 |