Immigrants from Portugal vs Immigrants from Yemen Kindergarten
COMPARE
Immigrants from Portugal
Immigrants from Yemen
Kindergarten
Kindergarten Comparison
Immigrants from Portugal
Immigrants from Yemen
97.3%
KINDERGARTEN
0.0/ 100
METRIC RATING
285th/ 347
METRIC RANK
95.9%
KINDERGARTEN
0.0/ 100
METRIC RATING
346th/ 347
METRIC RANK
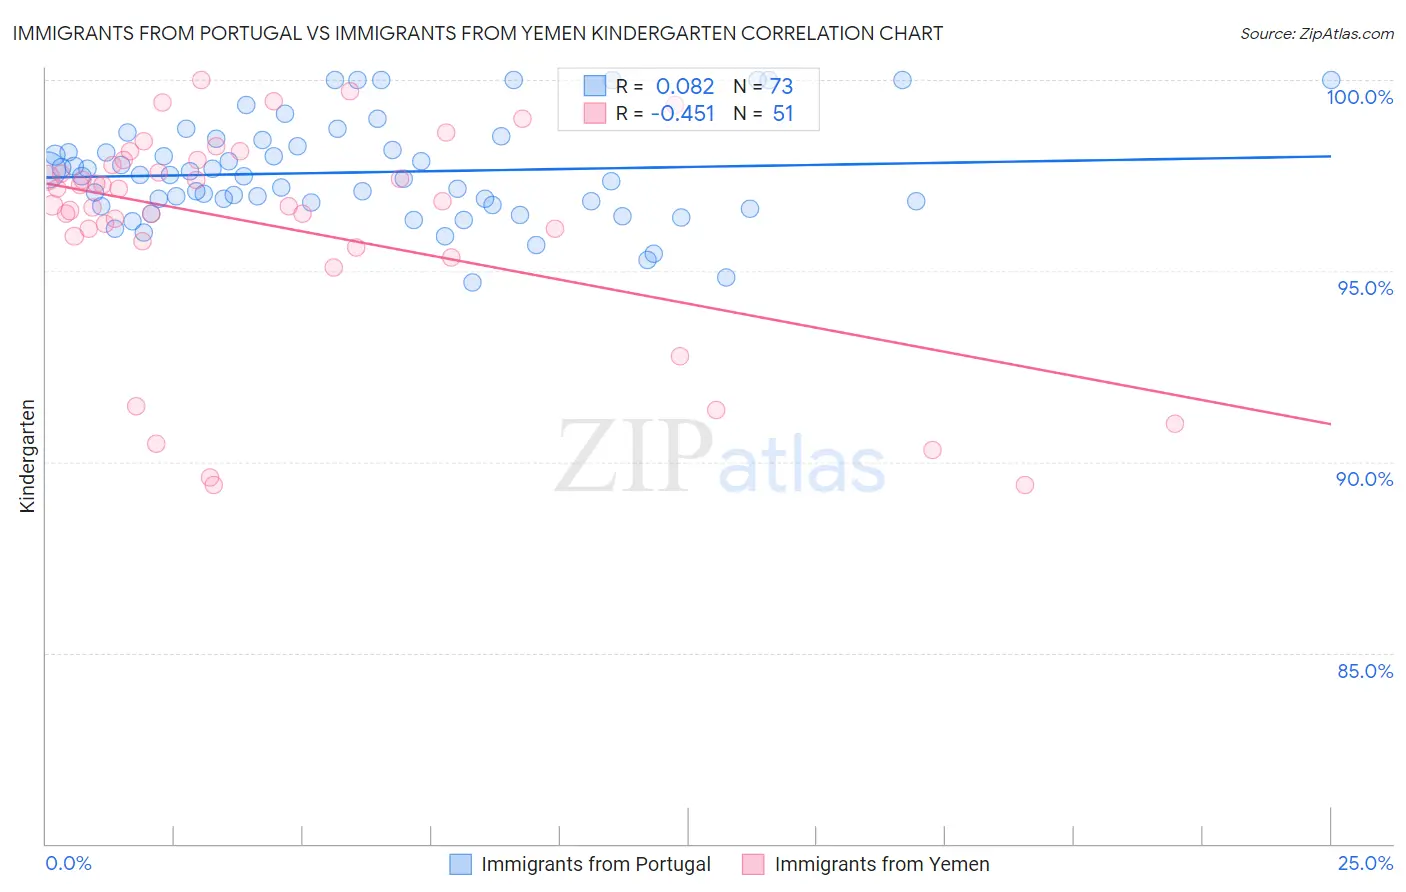
Immigrants from Portugal vs Immigrants from Yemen Kindergarten Correlation Chart
The statistical analysis conducted on geographies consisting of 174,792,107 people shows a slight positive correlation between the proportion of Immigrants from Portugal and percentage of population with at least kindergarten education in the United States with a correlation coefficient (R) of 0.082 and weighted average of 97.3%. Similarly, the statistical analysis conducted on geographies consisting of 82,433,611 people shows a moderate negative correlation between the proportion of Immigrants from Yemen and percentage of population with at least kindergarten education in the United States with a correlation coefficient (R) of -0.451 and weighted average of 95.9%, a difference of 1.5%.
Kindergarten Correlation Summary
| Measurement | Immigrants from Portugal | Immigrants from Yemen |
| Minimum | 94.7% | 89.4% |
| Maximum | 100.0% | 100.0% |
| Range | 5.3% | 10.6% |
| Mean | 97.6% | 96.2% |
| Median | 97.5% | 96.8% |
| Interquartile 25% (IQ1) | 96.8% | 95.8% |
| Interquartile 75% (IQ3) | 98.3% | 97.9% |
| Interquartile Range (IQR) | 1.6% | 2.1% |
| Standard Deviation (Sample) | 1.3% | 2.8% |
| Standard Deviation (Population) | 1.3% | 2.8% |
Similar Demographics by Kindergarten
Demographics Similar to Immigrants from Portugal by Kindergarten
In terms of kindergarten, the demographic groups most similar to Immigrants from Portugal are Immigrants from Trinidad and Tobago (97.3%, a difference of 0.010%), Immigrants from Barbados (97.3%, a difference of 0.010%), Immigrants from Hong Kong (97.3%, a difference of 0.010%), Immigrants from West Indies (97.3%, a difference of 0.020%), and Immigrants from Thailand (97.3%, a difference of 0.020%).
| Demographics | Rating | Rank | Kindergarten |
| Immigrants | Uzbekistan | 0.1 /100 | #278 | Tragic 97.4% |
| Immigrants | Ghana | 0.1 /100 | #279 | Tragic 97.4% |
| Barbadians | 0.1 /100 | #280 | Tragic 97.4% |
| Trinidadians and Tobagonians | 0.1 /100 | #281 | Tragic 97.4% |
| Afghans | 0.0 /100 | #282 | Tragic 97.4% |
| Immigrants | West Indies | 0.0 /100 | #283 | Tragic 97.3% |
| Immigrants | Trinidad and Tobago | 0.0 /100 | #284 | Tragic 97.3% |
| Immigrants | Portugal | 0.0 /100 | #285 | Tragic 97.3% |
| Immigrants | Barbados | 0.0 /100 | #286 | Tragic 97.3% |
| Immigrants | Hong Kong | 0.0 /100 | #287 | Tragic 97.3% |
| Immigrants | Thailand | 0.0 /100 | #288 | Tragic 97.3% |
| Immigrants | Afghanistan | 0.0 /100 | #289 | Tragic 97.3% |
| Immigrants | St. Vincent and the Grenadines | 0.0 /100 | #290 | Tragic 97.3% |
| Houma | 0.0 /100 | #291 | Tragic 97.3% |
| British West Indians | 0.0 /100 | #292 | Tragic 97.3% |
Demographics Similar to Immigrants from Yemen by Kindergarten
In terms of kindergarten, the demographic groups most similar to Immigrants from Yemen are Spanish American Indian (95.8%, a difference of 0.070%), Nepalese (96.2%, a difference of 0.34%), Immigrants from El Salvador (96.2%, a difference of 0.34%), Salvadoran (96.3%, a difference of 0.49%), and Immigrants from Mexico (96.4%, a difference of 0.52%).
| Demographics | Rating | Rank | Kindergarten |
| Central Americans | 0.0 /100 | #333 | Tragic 96.6% |
| Immigrants | Dominican Republic | 0.0 /100 | #334 | Tragic 96.6% |
| Bangladeshis | 0.0 /100 | #335 | Tragic 96.6% |
| Guatemalans | 0.0 /100 | #336 | Tragic 96.5% |
| Immigrants | Cambodia | 0.0 /100 | #337 | Tragic 96.5% |
| Immigrants | Fiji | 0.0 /100 | #338 | Tragic 96.5% |
| Immigrants | Guatemala | 0.0 /100 | #339 | Tragic 96.4% |
| Immigrants | Central America | 0.0 /100 | #340 | Tragic 96.4% |
| Immigrants | Cabo Verde | 0.0 /100 | #341 | Tragic 96.4% |
| Immigrants | Mexico | 0.0 /100 | #342 | Tragic 96.4% |
| Salvadorans | 0.0 /100 | #343 | Tragic 96.3% |
| Nepalese | 0.0 /100 | #344 | Tragic 96.2% |
| Immigrants | El Salvador | 0.0 /100 | #345 | Tragic 96.2% |
| Immigrants | Yemen | 0.0 /100 | #346 | Tragic 95.9% |
| Spanish American Indians | 0.0 /100 | #347 | Tragic 95.8% |