Arab vs Colville Median Family Income
COMPARE
Arab
Colville
Median Family Income
Median Family Income Comparison
Arabs
Colville
$106,952
MEDIAN FAMILY INCOME
89.9/ 100
METRIC RATING
129th/ 347
METRIC RANK
$85,792
MEDIAN FAMILY INCOME
0.0/ 100
METRIC RATING
301st/ 347
METRIC RANK
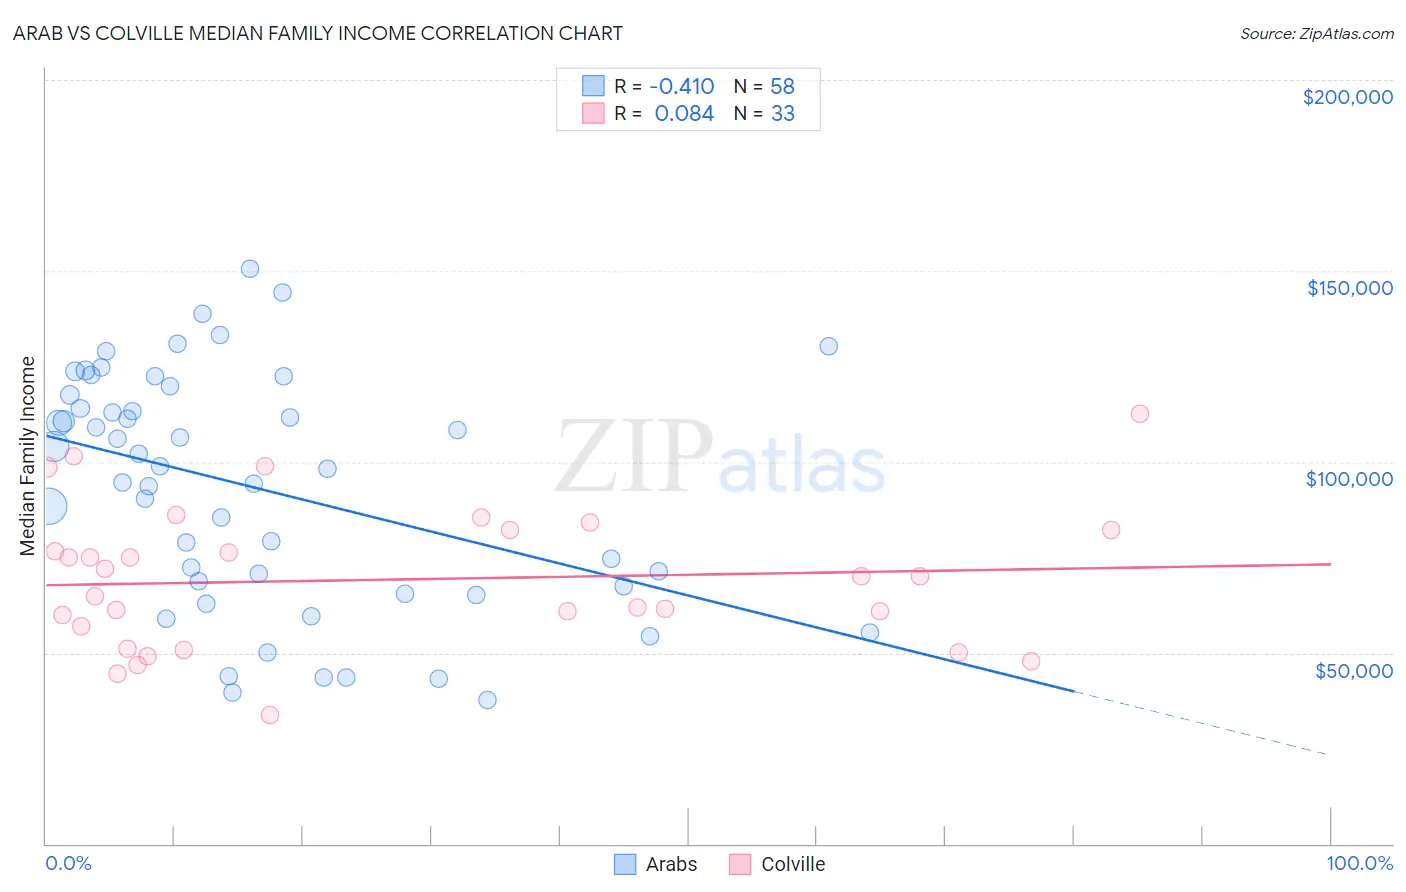
Arab vs Colville Median Family Income Correlation Chart
The statistical analysis conducted on geographies consisting of 486,153,527 people shows a moderate negative correlation between the proportion of Arabs and median family income in the United States with a correlation coefficient (R) of -0.410 and weighted average of $106,952. Similarly, the statistical analysis conducted on geographies consisting of 34,680,416 people shows a slight positive correlation between the proportion of Colville and median family income in the United States with a correlation coefficient (R) of 0.084 and weighted average of $85,792, a difference of 24.7%.
Median Family Income Correlation Summary
| Measurement | Arab | Colville |
| Minimum | $37,540 | $33,824 |
| Maximum | $150,441 | $112,639 |
| Range | $112,901 | $78,815 |
| Mean | $93,185 | $69,185 |
| Median | $98,519 | $70,000 |
| Interquartile 25% (IQ1) | $67,570 | $53,997 |
| Interquartile 75% (IQ3) | $117,614 | $82,061 |
| Interquartile Range (IQR) | $50,044 | $28,064 |
| Standard Deviation (Sample) | $30,451 | $18,382 |
| Standard Deviation (Population) | $30,188 | $18,102 |
Similar Demographics by Median Family Income
Demographics Similar to Arabs by Median Family Income
In terms of median family income, the demographic groups most similar to Arabs are Brazilian ($106,942, a difference of 0.010%), Immigrants from Ethiopia ($106,969, a difference of 0.020%), Lebanese ($107,086, a difference of 0.12%), Serbian ($107,157, a difference of 0.19%), and Taiwanese ($107,295, a difference of 0.32%).
| Demographics | Rating | Rank | Median Family Income |
| Immigrants | Jordan | 92.9 /100 | #122 | Exceptional $107,715 |
| Carpatho Rusyns | 92.2 /100 | #123 | Exceptional $107,502 |
| Pakistanis | 91.7 /100 | #124 | Exceptional $107,390 |
| Taiwanese | 91.4 /100 | #125 | Exceptional $107,295 |
| Serbians | 90.8 /100 | #126 | Exceptional $107,157 |
| Lebanese | 90.5 /100 | #127 | Exceptional $107,086 |
| Immigrants | Ethiopia | 90.0 /100 | #128 | Excellent $106,969 |
| Arabs | 89.9 /100 | #129 | Excellent $106,952 |
| Brazilians | 89.8 /100 | #130 | Excellent $106,942 |
| Canadians | 88.1 /100 | #131 | Excellent $106,597 |
| Immigrants | Fiji | 87.8 /100 | #132 | Excellent $106,544 |
| Ugandans | 87.8 /100 | #133 | Excellent $106,541 |
| Immigrants | Oceania | 87.3 /100 | #134 | Excellent $106,453 |
| Portuguese | 86.3 /100 | #135 | Excellent $106,286 |
| Immigrants | South Eastern Asia | 86.1 /100 | #136 | Excellent $106,252 |
Demographics Similar to Colville by Median Family Income
In terms of median family income, the demographic groups most similar to Colville are Spanish American Indian ($85,728, a difference of 0.070%), Hispanic or Latino ($85,647, a difference of 0.17%), Mexican ($85,618, a difference of 0.20%), Paiute ($85,414, a difference of 0.44%), and Immigrants from Dominica ($85,411, a difference of 0.45%).
| Demographics | Rating | Rank | Median Family Income |
| Fijians | 0.0 /100 | #294 | Tragic $87,387 |
| Yaqui | 0.0 /100 | #295 | Tragic $87,289 |
| Immigrants | Guatemala | 0.0 /100 | #296 | Tragic $87,191 |
| Cajuns | 0.0 /100 | #297 | Tragic $87,157 |
| Immigrants | Latin America | 0.0 /100 | #298 | Tragic $86,989 |
| Chippewa | 0.0 /100 | #299 | Tragic $86,852 |
| Ottawa | 0.0 /100 | #300 | Tragic $86,380 |
| Colville | 0.0 /100 | #301 | Tragic $85,792 |
| Spanish American Indians | 0.0 /100 | #302 | Tragic $85,728 |
| Hispanics or Latinos | 0.0 /100 | #303 | Tragic $85,647 |
| Mexicans | 0.0 /100 | #304 | Tragic $85,618 |
| Paiute | 0.0 /100 | #305 | Tragic $85,414 |
| Immigrants | Dominica | 0.0 /100 | #306 | Tragic $85,411 |
| Chickasaw | 0.0 /100 | #307 | Tragic $85,356 |
| U.S. Virgin Islanders | 0.0 /100 | #308 | Tragic $85,294 |