Immigrants from Poland vs Paiute Median Household Income
COMPARE
Immigrants from Poland
Paiute
Median Household Income
Median Household Income Comparison
Immigrants from Poland
Paiute
$90,549
MEDIAN HOUSEHOLD INCOME
97.1/ 100
METRIC RATING
111th/ 347
METRIC RANK
$72,959
MEDIAN HOUSEHOLD INCOME
0.0/ 100
METRIC RATING
298th/ 347
METRIC RANK
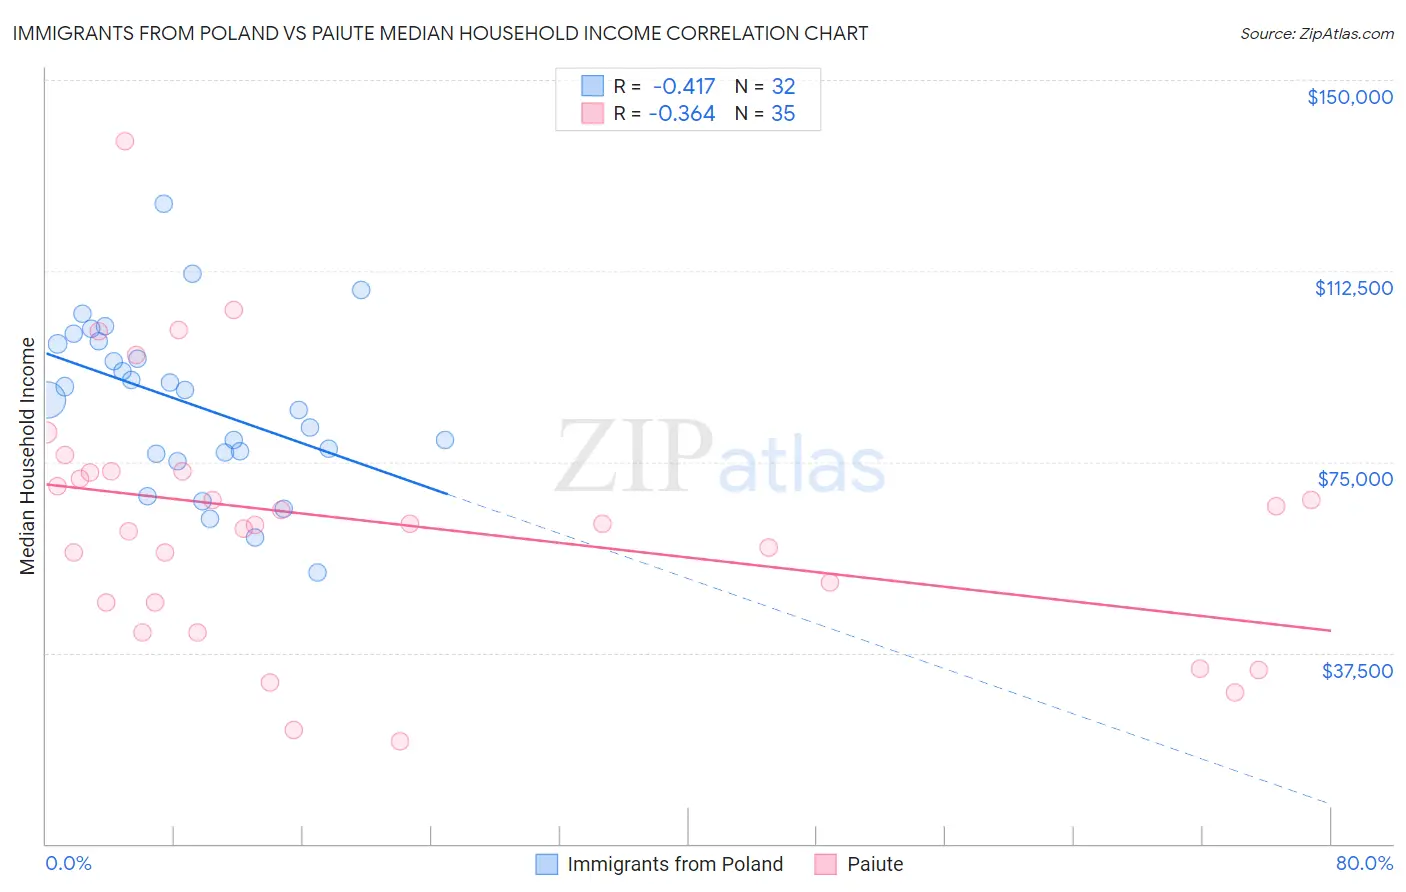
Immigrants from Poland vs Paiute Median Household Income Correlation Chart
The statistical analysis conducted on geographies consisting of 304,762,880 people shows a moderate negative correlation between the proportion of Immigrants from Poland and median household income in the United States with a correlation coefficient (R) of -0.417 and weighted average of $90,549. Similarly, the statistical analysis conducted on geographies consisting of 58,395,139 people shows a mild negative correlation between the proportion of Paiute and median household income in the United States with a correlation coefficient (R) of -0.364 and weighted average of $72,959, a difference of 24.1%.
Median Household Income Correlation Summary
| Measurement | Immigrants from Poland | Paiute |
| Minimum | $53,329 | $20,139 |
| Maximum | $125,589 | $138,043 |
| Range | $72,260 | $117,904 |
| Mean | $86,504 | $63,163 |
| Median | $88,122 | $62,760 |
| Interquartile 25% (IQ1) | $76,692 | $47,361 |
| Interquartile 75% (IQ3) | $98,535 | $73,101 |
| Interquartile Range (IQR) | $21,843 | $25,740 |
| Standard Deviation (Sample) | $16,261 | $24,968 |
| Standard Deviation (Population) | $16,005 | $24,608 |
Similar Demographics by Median Household Income
Demographics Similar to Immigrants from Poland by Median Household Income
In terms of median household income, the demographic groups most similar to Immigrants from Poland are Palestinian ($90,574, a difference of 0.030%), Chilean ($90,605, a difference of 0.060%), Zimbabwean ($90,618, a difference of 0.080%), Northern European ($90,446, a difference of 0.11%), and Croatian ($90,685, a difference of 0.15%).
| Demographics | Rating | Rank | Median Household Income |
| Immigrants | Kazakhstan | 97.8 /100 | #104 | Exceptional $91,015 |
| Immigrants | Brazil | 97.7 /100 | #105 | Exceptional $90,907 |
| Macedonians | 97.4 /100 | #106 | Exceptional $90,761 |
| Croatians | 97.3 /100 | #107 | Exceptional $90,685 |
| Zimbabweans | 97.2 /100 | #108 | Exceptional $90,618 |
| Chileans | 97.2 /100 | #109 | Exceptional $90,605 |
| Palestinians | 97.1 /100 | #110 | Exceptional $90,574 |
| Immigrants | Poland | 97.1 /100 | #111 | Exceptional $90,549 |
| Northern Europeans | 96.9 /100 | #112 | Exceptional $90,446 |
| Peruvians | 96.5 /100 | #113 | Exceptional $90,261 |
| Immigrants | Northern Africa | 95.9 /100 | #114 | Exceptional $90,026 |
| Immigrants | Western Asia | 95.9 /100 | #115 | Exceptional $90,005 |
| Native Hawaiians | 95.7 /100 | #116 | Exceptional $89,919 |
| Taiwanese | 95.6 /100 | #117 | Exceptional $89,900 |
| Syrians | 95.4 /100 | #118 | Exceptional $89,830 |
Demographics Similar to Paiute by Median Household Income
In terms of median household income, the demographic groups most similar to Paiute are Indonesian ($72,856, a difference of 0.14%), Immigrants from Mexico ($73,160, a difference of 0.27%), Immigrants from Dominica ($72,760, a difference of 0.27%), Cherokee ($72,682, a difference of 0.38%), and Shoshone ($72,660, a difference of 0.41%).
| Demographics | Rating | Rank | Median Household Income |
| Hispanics or Latinos | 0.1 /100 | #291 | Tragic $73,823 |
| Comanche | 0.1 /100 | #292 | Tragic $73,747 |
| Immigrants | Cabo Verde | 0.1 /100 | #293 | Tragic $73,515 |
| Blackfeet | 0.1 /100 | #294 | Tragic $73,509 |
| Cubans | 0.1 /100 | #295 | Tragic $73,392 |
| Haitians | 0.1 /100 | #296 | Tragic $73,306 |
| Immigrants | Mexico | 0.0 /100 | #297 | Tragic $73,160 |
| Paiute | 0.0 /100 | #298 | Tragic $72,959 |
| Indonesians | 0.0 /100 | #299 | Tragic $72,856 |
| Immigrants | Dominica | 0.0 /100 | #300 | Tragic $72,760 |
| Cherokee | 0.0 /100 | #301 | Tragic $72,682 |
| Shoshone | 0.0 /100 | #302 | Tragic $72,660 |
| Africans | 0.0 /100 | #303 | Tragic $72,650 |
| Immigrants | Haiti | 0.0 /100 | #304 | Tragic $72,599 |
| Hondurans | 0.0 /100 | #305 | Tragic $72,588 |