Iraqi vs Paiute Median Household Income
COMPARE
Iraqi
Paiute
Median Household Income
Median Household Income Comparison
Iraqis
Paiute
$83,753
MEDIAN HOUSEHOLD INCOME
29.6/ 100
METRIC RATING
191st/ 347
METRIC RANK
$72,959
MEDIAN HOUSEHOLD INCOME
0.0/ 100
METRIC RATING
298th/ 347
METRIC RANK
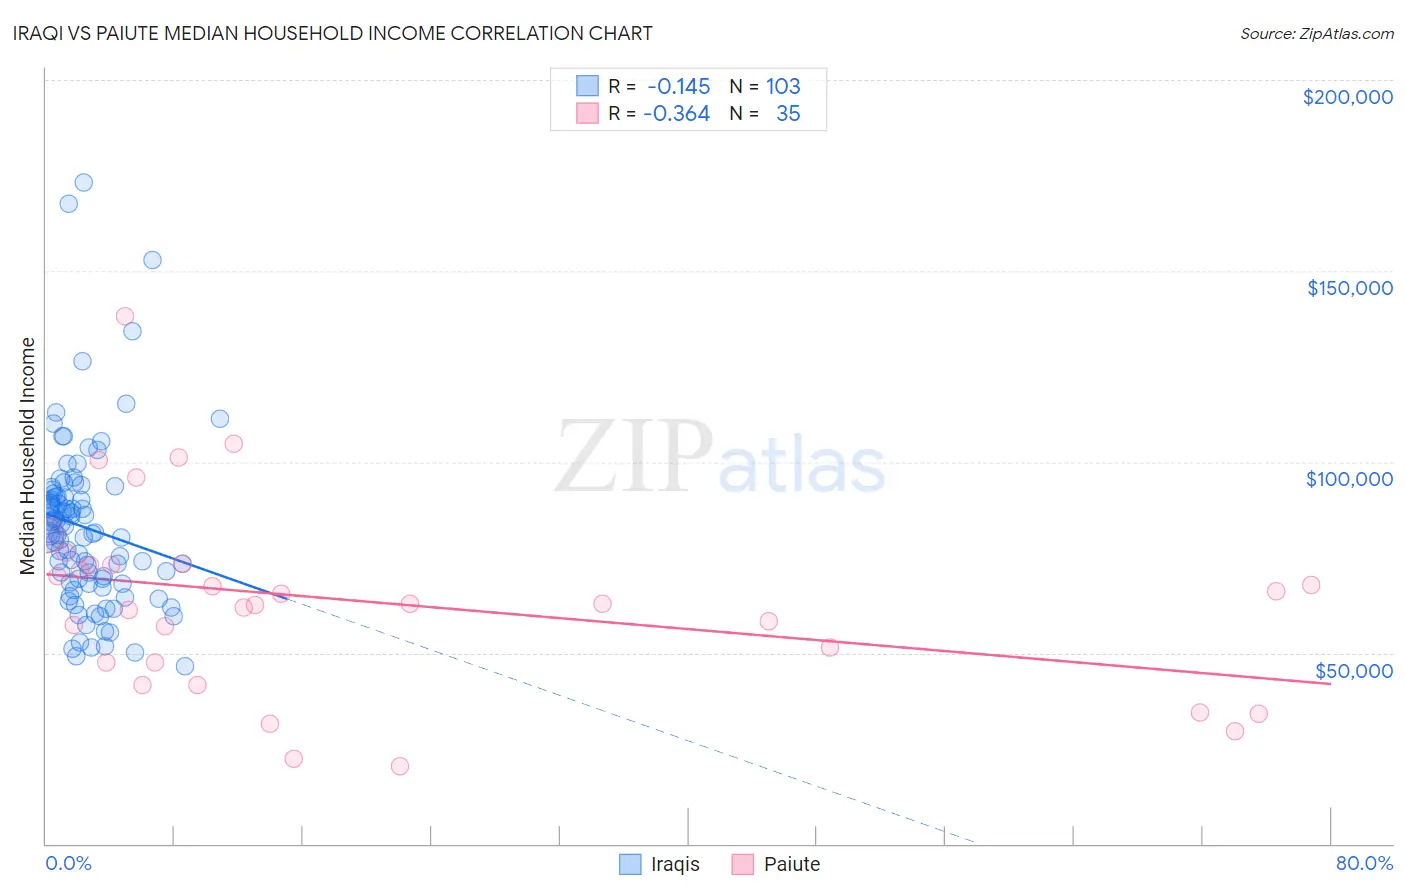
Iraqi vs Paiute Median Household Income Correlation Chart
The statistical analysis conducted on geographies consisting of 170,587,047 people shows a poor negative correlation between the proportion of Iraqis and median household income in the United States with a correlation coefficient (R) of -0.145 and weighted average of $83,753. Similarly, the statistical analysis conducted on geographies consisting of 58,395,139 people shows a mild negative correlation between the proportion of Paiute and median household income in the United States with a correlation coefficient (R) of -0.364 and weighted average of $72,959, a difference of 14.8%.
Median Household Income Correlation Summary
| Measurement | Iraqi | Paiute |
| Minimum | $46,565 | $20,139 |
| Maximum | $173,015 | $138,043 |
| Range | $126,450 | $117,904 |
| Mean | $82,738 | $63,163 |
| Median | $81,250 | $62,760 |
| Interquartile 25% (IQ1) | $68,093 | $47,361 |
| Interquartile 75% (IQ3) | $91,098 | $73,101 |
| Interquartile Range (IQR) | $23,005 | $25,740 |
| Standard Deviation (Sample) | $22,309 | $24,968 |
| Standard Deviation (Population) | $22,201 | $24,608 |
Similar Demographics by Median Household Income
Demographics Similar to Iraqis by Median Household Income
In terms of median household income, the demographic groups most similar to Iraqis are Slovak ($83,798, a difference of 0.050%), Welsh ($83,628, a difference of 0.15%), Immigrants from Colombia ($83,902, a difference of 0.18%), Finnish ($83,607, a difference of 0.18%), and Ghanaian ($83,582, a difference of 0.21%).
| Demographics | Rating | Rank | Median Household Income |
| Immigrants | Eastern Africa | 37.4 /100 | #184 | Fair $84,299 |
| Kenyans | 34.2 /100 | #185 | Fair $84,085 |
| Puget Sound Salish | 33.2 /100 | #186 | Fair $84,011 |
| Belgians | 33.2 /100 | #187 | Fair $84,008 |
| Tlingit-Haida | 32.6 /100 | #188 | Fair $83,968 |
| Immigrants | Colombia | 31.7 /100 | #189 | Fair $83,902 |
| Slovaks | 30.2 /100 | #190 | Fair $83,798 |
| Iraqis | 29.6 /100 | #191 | Fair $83,753 |
| Welsh | 28.0 /100 | #192 | Fair $83,628 |
| Finns | 27.7 /100 | #193 | Fair $83,607 |
| Ghanaians | 27.4 /100 | #194 | Fair $83,582 |
| Immigrants | Armenia | 27.0 /100 | #195 | Fair $83,555 |
| French | 26.0 /100 | #196 | Fair $83,468 |
| Aleuts | 25.7 /100 | #197 | Fair $83,446 |
| Japanese | 25.1 /100 | #198 | Fair $83,395 |
Demographics Similar to Paiute by Median Household Income
In terms of median household income, the demographic groups most similar to Paiute are Indonesian ($72,856, a difference of 0.14%), Immigrants from Mexico ($73,160, a difference of 0.27%), Immigrants from Dominica ($72,760, a difference of 0.27%), Cherokee ($72,682, a difference of 0.38%), and Shoshone ($72,660, a difference of 0.41%).
| Demographics | Rating | Rank | Median Household Income |
| Hispanics or Latinos | 0.1 /100 | #291 | Tragic $73,823 |
| Comanche | 0.1 /100 | #292 | Tragic $73,747 |
| Immigrants | Cabo Verde | 0.1 /100 | #293 | Tragic $73,515 |
| Blackfeet | 0.1 /100 | #294 | Tragic $73,509 |
| Cubans | 0.1 /100 | #295 | Tragic $73,392 |
| Haitians | 0.1 /100 | #296 | Tragic $73,306 |
| Immigrants | Mexico | 0.0 /100 | #297 | Tragic $73,160 |
| Paiute | 0.0 /100 | #298 | Tragic $72,959 |
| Indonesians | 0.0 /100 | #299 | Tragic $72,856 |
| Immigrants | Dominica | 0.0 /100 | #300 | Tragic $72,760 |
| Cherokee | 0.0 /100 | #301 | Tragic $72,682 |
| Shoshone | 0.0 /100 | #302 | Tragic $72,660 |
| Africans | 0.0 /100 | #303 | Tragic $72,650 |
| Immigrants | Haiti | 0.0 /100 | #304 | Tragic $72,599 |
| Hondurans | 0.0 /100 | #305 | Tragic $72,588 |