Immigrants from Poland vs Paiute In Labor Force | Age 30-34
COMPARE
Immigrants from Poland
Paiute
In Labor Force | Age 30-34
In Labor Force | Age 30-34 Comparison
Immigrants from Poland
Paiute
85.5%
IN LABOR FORCE | AGE 30-34
99.5/ 100
METRIC RATING
59th/ 347
METRIC RANK
81.2%
IN LABOR FORCE | AGE 30-34
0.0/ 100
METRIC RATING
323rd/ 347
METRIC RANK
Immigrants from Poland vs Paiute In Labor Force | Age 30-34 Correlation Chart
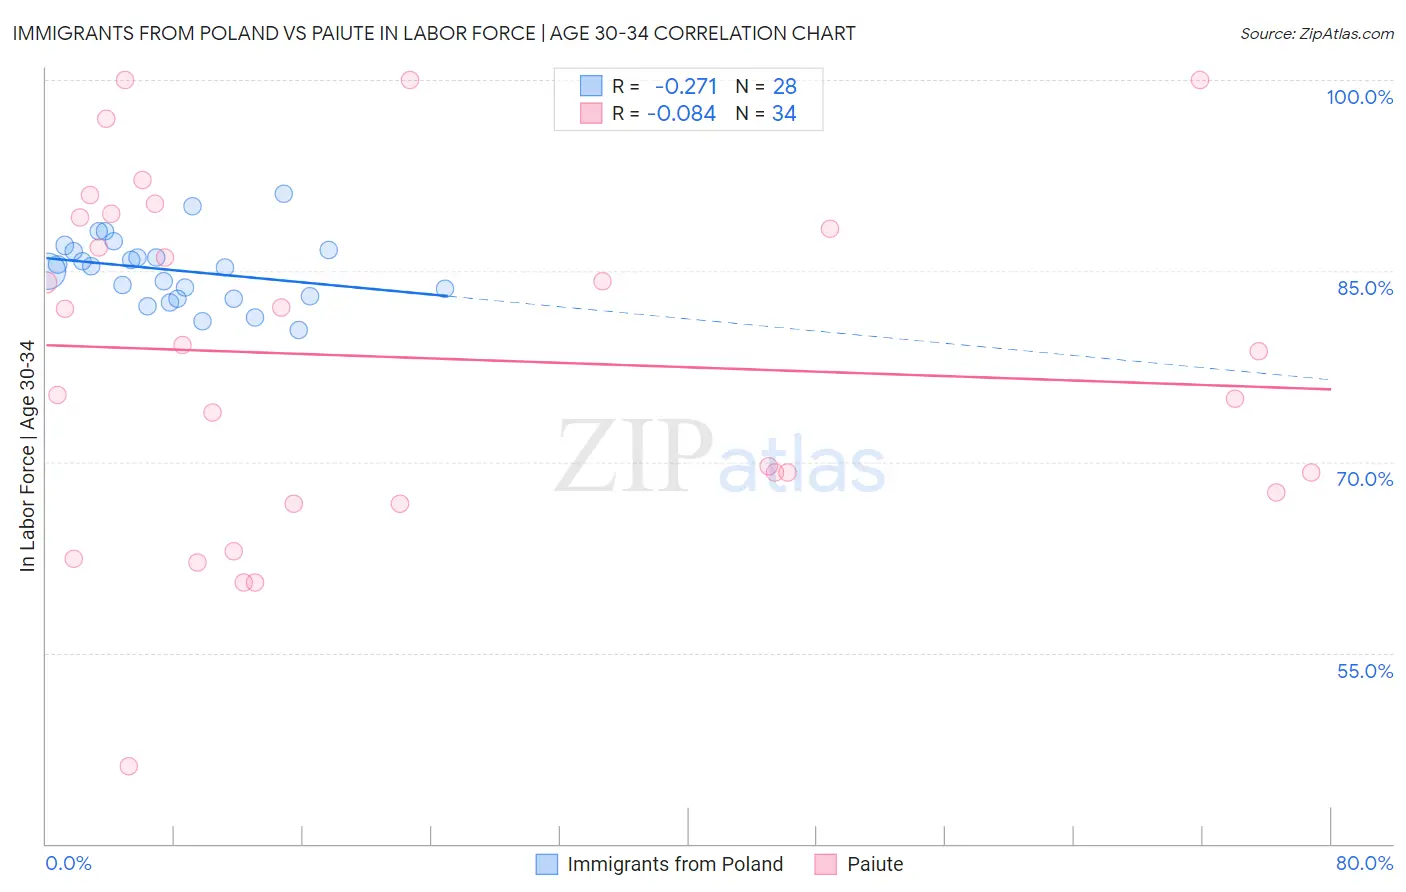
The statistical analysis conducted on geographies consisting of 304,756,662 people shows a weak negative correlation between the proportion of Immigrants from Poland and labor force participation rate among population between the ages 30 and 34 in the United States with a correlation coefficient (R) of -0.271 and weighted average of 85.5%. Similarly, the statistical analysis conducted on geographies consisting of 58,394,900 people shows a slight negative correlation between the proportion of Paiute and labor force participation rate among population between the ages 30 and 34 in the United States with a correlation coefficient (R) of -0.084 and weighted average of 81.2%, a difference of 5.3%.
In Labor Force | Age 30-34 Correlation Summary
| Measurement | Immigrants from Poland | Paiute |
| Minimum | 80.4% | 46.1% |
| Maximum | 91.1% | 100.0% |
| Range | 10.7% | 53.9% |
| Mean | 85.0% | 78.2% |
| Median | 85.3% | 78.9% |
| Interquartile 25% (IQ1) | 82.9% | 67.6% |
| Interquartile 75% (IQ3) | 86.6% | 89.2% |
| Interquartile Range (IQR) | 3.7% | 21.6% |
| Standard Deviation (Sample) | 2.6% | 13.5% |
| Standard Deviation (Population) | 2.6% | 13.3% |
Similar Demographics by In Labor Force | Age 30-34
Demographics Similar to Immigrants from Poland by In Labor Force | Age 30-34
In terms of in labor force | age 30-34, the demographic groups most similar to Immigrants from Poland are Polish (85.5%, a difference of 0.010%), Immigrants from Turkey (85.5%, a difference of 0.020%), Czech (85.5%, a difference of 0.020%), Russian (85.5%, a difference of 0.020%), and Immigrants from France (85.5%, a difference of 0.020%).
| Demographics | Rating | Rank | In Labor Force | Age 30-34 |
| Slovenes | 99.7 /100 | #52 | Exceptional 85.6% |
| Filipinos | 99.6 /100 | #53 | Exceptional 85.5% |
| Immigrants | Kenya | 99.6 /100 | #54 | Exceptional 85.5% |
| Immigrants | Turkey | 99.6 /100 | #55 | Exceptional 85.5% |
| Czechs | 99.6 /100 | #56 | Exceptional 85.5% |
| Russians | 99.6 /100 | #57 | Exceptional 85.5% |
| Poles | 99.6 /100 | #58 | Exceptional 85.5% |
| Immigrants | Poland | 99.5 /100 | #59 | Exceptional 85.5% |
| Immigrants | France | 99.5 /100 | #60 | Exceptional 85.5% |
| Immigrants | Brazil | 99.5 /100 | #61 | Exceptional 85.5% |
| Soviet Union | 99.4 /100 | #62 | Exceptional 85.5% |
| Macedonians | 99.4 /100 | #63 | Exceptional 85.5% |
| Italians | 99.4 /100 | #64 | Exceptional 85.4% |
| Senegalese | 99.4 /100 | #65 | Exceptional 85.4% |
| Ghanaians | 99.4 /100 | #66 | Exceptional 85.4% |
Demographics Similar to Paiute by In Labor Force | Age 30-34
In terms of in labor force | age 30-34, the demographic groups most similar to Paiute are Cheyenne (81.1%, a difference of 0.030%), Puerto Rican (81.2%, a difference of 0.050%), Dutch West Indian (81.0%, a difference of 0.19%), Alaska Native (81.3%, a difference of 0.20%), and Yaqui (81.4%, a difference of 0.28%).
| Demographics | Rating | Rank | In Labor Force | Age 30-34 |
| Immigrants | Azores | 0.0 /100 | #316 | Tragic 81.5% |
| Arapaho | 0.0 /100 | #317 | Tragic 81.5% |
| Choctaw | 0.0 /100 | #318 | Tragic 81.4% |
| Shoshone | 0.0 /100 | #319 | Tragic 81.4% |
| Yaqui | 0.0 /100 | #320 | Tragic 81.4% |
| Alaska Natives | 0.0 /100 | #321 | Tragic 81.3% |
| Puerto Ricans | 0.0 /100 | #322 | Tragic 81.2% |
| Paiute | 0.0 /100 | #323 | Tragic 81.2% |
| Cheyenne | 0.0 /100 | #324 | Tragic 81.1% |
| Dutch West Indians | 0.0 /100 | #325 | Tragic 81.0% |
| Seminole | 0.0 /100 | #326 | Tragic 80.8% |
| Colville | 0.0 /100 | #327 | Tragic 80.7% |
| Sioux | 0.0 /100 | #328 | Tragic 80.4% |
| Creek | 0.0 /100 | #329 | Tragic 80.4% |
| Pueblo | 0.0 /100 | #330 | Tragic 80.0% |