Eastern European vs Paiute Median Household Income
COMPARE
Eastern European
Paiute
Median Household Income
Median Household Income Comparison
Eastern Europeans
Paiute
$101,781
MEDIAN HOUSEHOLD INCOME
100.0/ 100
METRIC RATING
21st/ 347
METRIC RANK
$72,959
MEDIAN HOUSEHOLD INCOME
0.0/ 100
METRIC RATING
298th/ 347
METRIC RANK
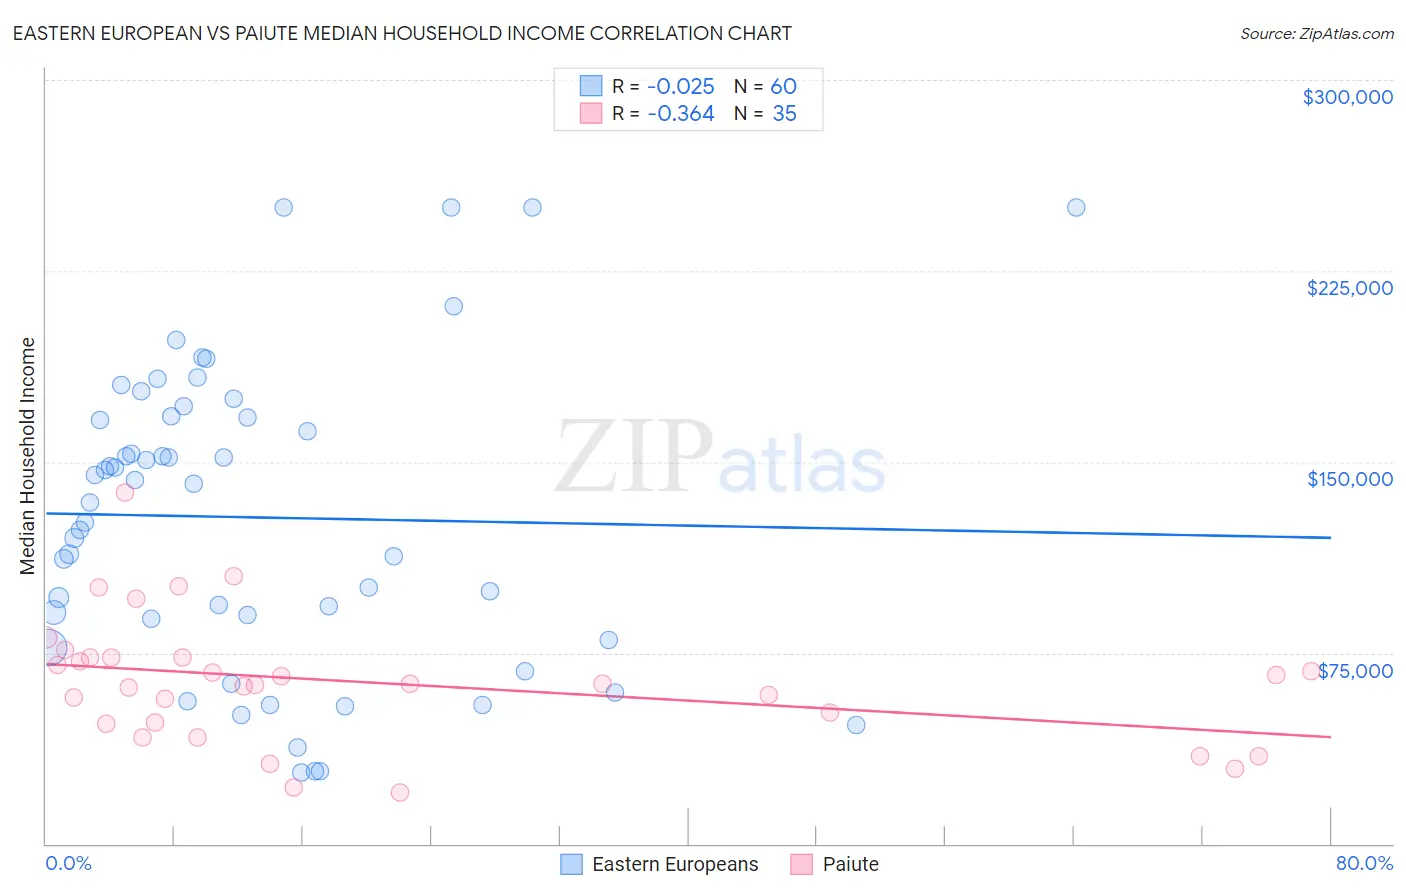
Eastern European vs Paiute Median Household Income Correlation Chart
The statistical analysis conducted on geographies consisting of 460,842,192 people shows no correlation between the proportion of Eastern Europeans and median household income in the United States with a correlation coefficient (R) of -0.025 and weighted average of $101,781. Similarly, the statistical analysis conducted on geographies consisting of 58,395,139 people shows a mild negative correlation between the proportion of Paiute and median household income in the United States with a correlation coefficient (R) of -0.364 and weighted average of $72,959, a difference of 39.5%.
Median Household Income Correlation Summary
| Measurement | Eastern European | Paiute |
| Minimum | $28,140 | $20,139 |
| Maximum | $250,001 | $138,043 |
| Range | $221,861 | $117,904 |
| Mean | $128,179 | $63,163 |
| Median | $137,749 | $62,760 |
| Interquartile 25% (IQ1) | $84,285 | $47,361 |
| Interquartile 75% (IQ3) | $167,660 | $73,101 |
| Interquartile Range (IQR) | $83,375 | $25,740 |
| Standard Deviation (Sample) | $58,971 | $24,968 |
| Standard Deviation (Population) | $58,477 | $24,608 |
Similar Demographics by Median Household Income
Demographics Similar to Eastern Europeans by Median Household Income
In terms of median household income, the demographic groups most similar to Eastern Europeans are Asian ($101,681, a difference of 0.10%), Immigrants from Bolivia ($101,394, a difference of 0.38%), Bolivian ($102,195, a difference of 0.41%), Immigrants from Australia ($102,562, a difference of 0.77%), and Cypriot ($102,843, a difference of 1.0%).
| Demographics | Rating | Rank | Median Household Income |
| Immigrants | Ireland | 100.0 /100 | #14 | Exceptional $104,692 |
| Immigrants | Israel | 100.0 /100 | #15 | Exceptional $104,090 |
| Burmese | 100.0 /100 | #16 | Exceptional $103,145 |
| Immigrants | Korea | 100.0 /100 | #17 | Exceptional $102,962 |
| Cypriots | 100.0 /100 | #18 | Exceptional $102,843 |
| Immigrants | Australia | 100.0 /100 | #19 | Exceptional $102,562 |
| Bolivians | 100.0 /100 | #20 | Exceptional $102,195 |
| Eastern Europeans | 100.0 /100 | #21 | Exceptional $101,781 |
| Asians | 100.0 /100 | #22 | Exceptional $101,681 |
| Immigrants | Bolivia | 100.0 /100 | #23 | Exceptional $101,394 |
| Immigrants | Japan | 100.0 /100 | #24 | Exceptional $100,711 |
| Immigrants | Sweden | 100.0 /100 | #25 | Exceptional $100,699 |
| Immigrants | Belgium | 100.0 /100 | #26 | Exceptional $100,306 |
| Bhutanese | 100.0 /100 | #27 | Exceptional $100,151 |
| Immigrants | Sri Lanka | 100.0 /100 | #28 | Exceptional $99,943 |
Demographics Similar to Paiute by Median Household Income
In terms of median household income, the demographic groups most similar to Paiute are Indonesian ($72,856, a difference of 0.14%), Immigrants from Mexico ($73,160, a difference of 0.27%), Immigrants from Dominica ($72,760, a difference of 0.27%), Cherokee ($72,682, a difference of 0.38%), and Shoshone ($72,660, a difference of 0.41%).
| Demographics | Rating | Rank | Median Household Income |
| Hispanics or Latinos | 0.1 /100 | #291 | Tragic $73,823 |
| Comanche | 0.1 /100 | #292 | Tragic $73,747 |
| Immigrants | Cabo Verde | 0.1 /100 | #293 | Tragic $73,515 |
| Blackfeet | 0.1 /100 | #294 | Tragic $73,509 |
| Cubans | 0.1 /100 | #295 | Tragic $73,392 |
| Haitians | 0.1 /100 | #296 | Tragic $73,306 |
| Immigrants | Mexico | 0.0 /100 | #297 | Tragic $73,160 |
| Paiute | 0.0 /100 | #298 | Tragic $72,959 |
| Indonesians | 0.0 /100 | #299 | Tragic $72,856 |
| Immigrants | Dominica | 0.0 /100 | #300 | Tragic $72,760 |
| Cherokee | 0.0 /100 | #301 | Tragic $72,682 |
| Shoshone | 0.0 /100 | #302 | Tragic $72,660 |
| Africans | 0.0 /100 | #303 | Tragic $72,650 |
| Immigrants | Haiti | 0.0 /100 | #304 | Tragic $72,599 |
| Hondurans | 0.0 /100 | #305 | Tragic $72,588 |