Immigrants from Poland vs Somali Median Household Income
COMPARE
Immigrants from Poland
Somali
Median Household Income
Median Household Income Comparison
Immigrants from Poland
Somalis
$90,549
MEDIAN HOUSEHOLD INCOME
97.1/ 100
METRIC RATING
111th/ 347
METRIC RANK
$75,782
MEDIAN HOUSEHOLD INCOME
0.3/ 100
METRIC RATING
272nd/ 347
METRIC RANK
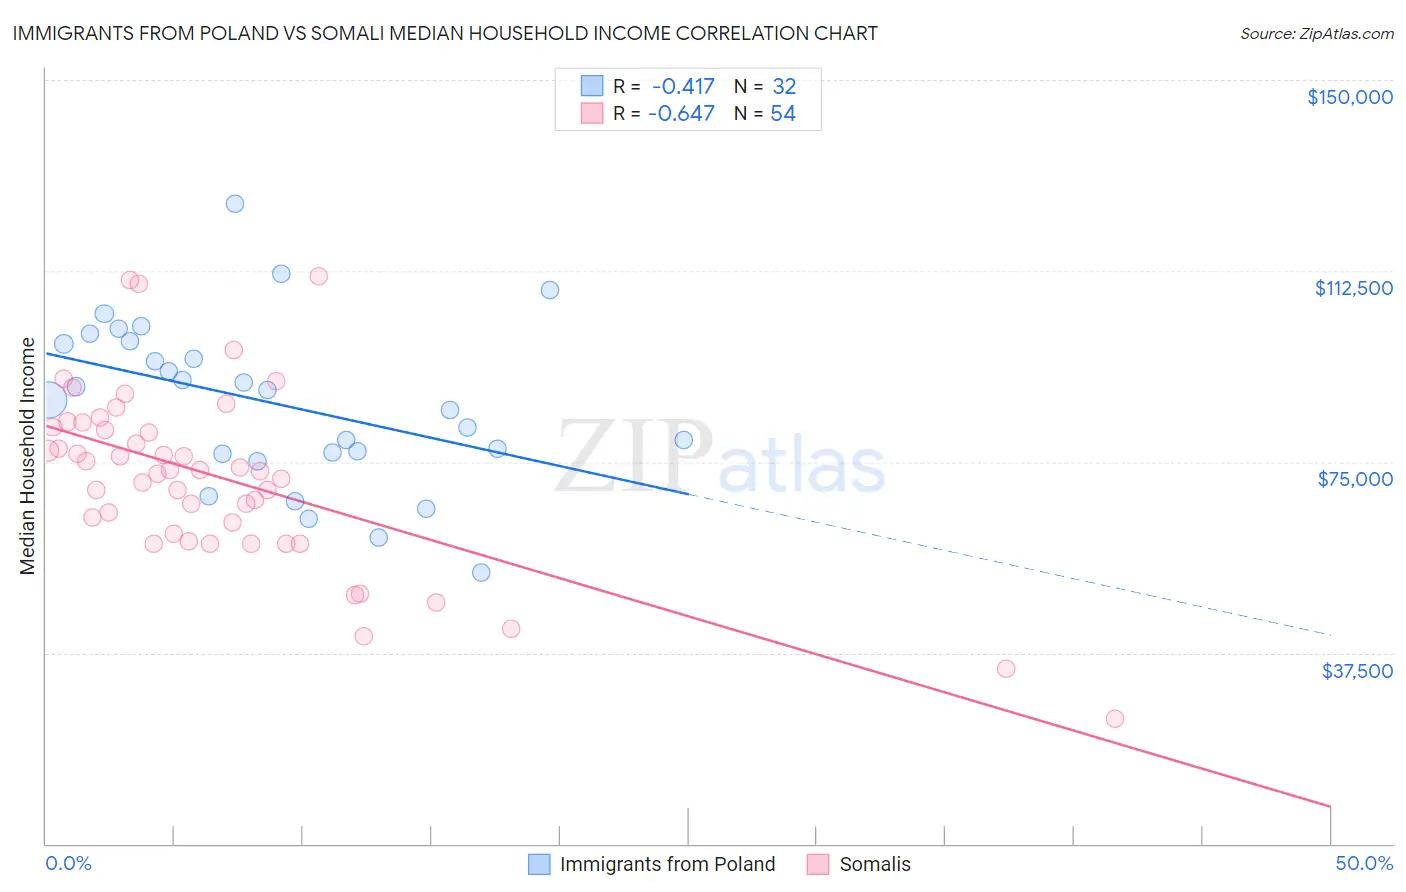
Immigrants from Poland vs Somali Median Household Income Correlation Chart
The statistical analysis conducted on geographies consisting of 304,762,880 people shows a moderate negative correlation between the proportion of Immigrants from Poland and median household income in the United States with a correlation coefficient (R) of -0.417 and weighted average of $90,549. Similarly, the statistical analysis conducted on geographies consisting of 99,284,368 people shows a significant negative correlation between the proportion of Somalis and median household income in the United States with a correlation coefficient (R) of -0.647 and weighted average of $75,782, a difference of 19.5%.
Median Household Income Correlation Summary
| Measurement | Immigrants from Poland | Somali |
| Minimum | $53,329 | $24,660 |
| Maximum | $125,589 | $111,550 |
| Range | $72,260 | $86,890 |
| Mean | $86,504 | $71,854 |
| Median | $88,122 | $73,292 |
| Interquartile 25% (IQ1) | $76,692 | $60,808 |
| Interquartile 75% (IQ3) | $98,535 | $81,847 |
| Interquartile Range (IQR) | $21,843 | $21,039 |
| Standard Deviation (Sample) | $16,261 | $17,515 |
| Standard Deviation (Population) | $16,005 | $17,352 |
Similar Demographics by Median Household Income
Demographics Similar to Immigrants from Poland by Median Household Income
In terms of median household income, the demographic groups most similar to Immigrants from Poland are Palestinian ($90,574, a difference of 0.030%), Chilean ($90,605, a difference of 0.060%), Zimbabwean ($90,618, a difference of 0.080%), Northern European ($90,446, a difference of 0.11%), and Croatian ($90,685, a difference of 0.15%).
| Demographics | Rating | Rank | Median Household Income |
| Immigrants | Kazakhstan | 97.8 /100 | #104 | Exceptional $91,015 |
| Immigrants | Brazil | 97.7 /100 | #105 | Exceptional $90,907 |
| Macedonians | 97.4 /100 | #106 | Exceptional $90,761 |
| Croatians | 97.3 /100 | #107 | Exceptional $90,685 |
| Zimbabweans | 97.2 /100 | #108 | Exceptional $90,618 |
| Chileans | 97.2 /100 | #109 | Exceptional $90,605 |
| Palestinians | 97.1 /100 | #110 | Exceptional $90,574 |
| Immigrants | Poland | 97.1 /100 | #111 | Exceptional $90,549 |
| Northern Europeans | 96.9 /100 | #112 | Exceptional $90,446 |
| Peruvians | 96.5 /100 | #113 | Exceptional $90,261 |
| Immigrants | Northern Africa | 95.9 /100 | #114 | Exceptional $90,026 |
| Immigrants | Western Asia | 95.9 /100 | #115 | Exceptional $90,005 |
| Native Hawaiians | 95.7 /100 | #116 | Exceptional $89,919 |
| Taiwanese | 95.6 /100 | #117 | Exceptional $89,900 |
| Syrians | 95.4 /100 | #118 | Exceptional $89,830 |
Demographics Similar to Somalis by Median Household Income
In terms of median household income, the demographic groups most similar to Somalis are Pennsylvania German ($75,814, a difference of 0.040%), Hmong ($75,839, a difference of 0.080%), Immigrants from Jamaica ($75,851, a difference of 0.090%), Cape Verdean ($75,848, a difference of 0.090%), and German Russian ($75,856, a difference of 0.10%).
| Demographics | Rating | Rank | Median Household Income |
| Immigrants | Belize | 0.3 /100 | #265 | Tragic $75,938 |
| Americans | 0.3 /100 | #266 | Tragic $75,932 |
| German Russians | 0.3 /100 | #267 | Tragic $75,856 |
| Immigrants | Jamaica | 0.3 /100 | #268 | Tragic $75,851 |
| Cape Verdeans | 0.3 /100 | #269 | Tragic $75,848 |
| Hmong | 0.3 /100 | #270 | Tragic $75,839 |
| Pennsylvania Germans | 0.3 /100 | #271 | Tragic $75,814 |
| Somalis | 0.3 /100 | #272 | Tragic $75,782 |
| Liberians | 0.2 /100 | #273 | Tragic $75,667 |
| British West Indians | 0.2 /100 | #274 | Tragic $75,647 |
| Immigrants | Micronesia | 0.2 /100 | #275 | Tragic $75,574 |
| Immigrants | Latin America | 0.2 /100 | #276 | Tragic $75,420 |
| Spanish Americans | 0.2 /100 | #277 | Tragic $75,386 |
| Osage | 0.2 /100 | #278 | Tragic $75,240 |
| Immigrants | Guatemala | 0.2 /100 | #279 | Tragic $75,123 |