Immigrants from Venezuela vs Paiute Median Household Income
COMPARE
Immigrants from Venezuela
Paiute
Median Household Income
Median Household Income Comparison
Immigrants from Venezuela
Paiute
$81,506
MEDIAN HOUSEHOLD INCOME
9.0/ 100
METRIC RATING
220th/ 347
METRIC RANK
$72,959
MEDIAN HOUSEHOLD INCOME
0.0/ 100
METRIC RATING
298th/ 347
METRIC RANK
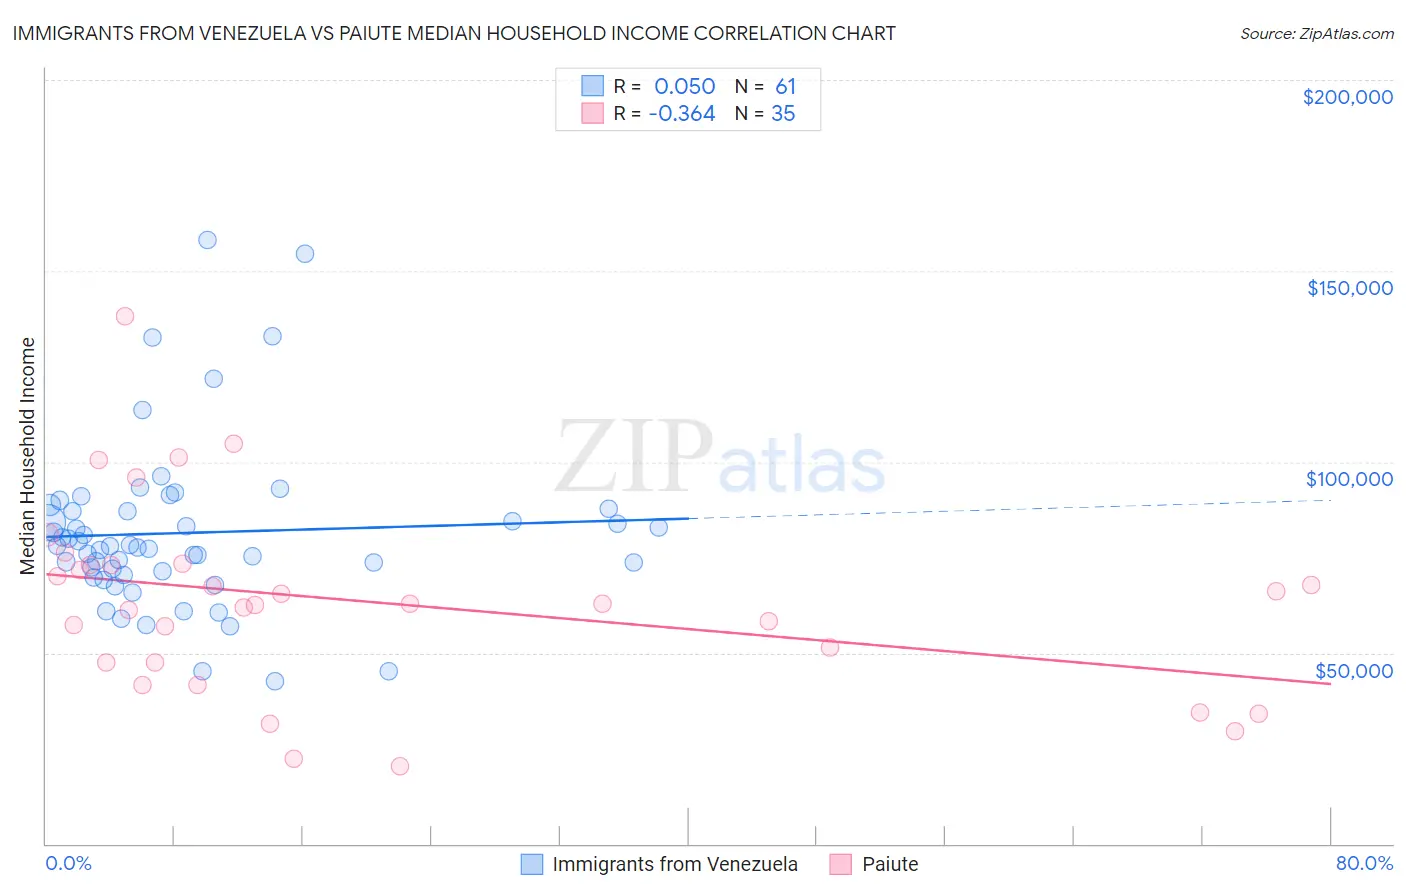
Immigrants from Venezuela vs Paiute Median Household Income Correlation Chart
The statistical analysis conducted on geographies consisting of 287,748,058 people shows a slight positive correlation between the proportion of Immigrants from Venezuela and median household income in the United States with a correlation coefficient (R) of 0.050 and weighted average of $81,506. Similarly, the statistical analysis conducted on geographies consisting of 58,395,139 people shows a mild negative correlation between the proportion of Paiute and median household income in the United States with a correlation coefficient (R) of -0.364 and weighted average of $72,959, a difference of 11.7%.
Median Household Income Correlation Summary
| Measurement | Immigrants from Venezuela | Paiute |
| Minimum | $42,664 | $20,139 |
| Maximum | $158,184 | $138,043 |
| Range | $115,520 | $117,904 |
| Mean | $81,402 | $63,163 |
| Median | $77,762 | $62,760 |
| Interquartile 25% (IQ1) | $70,867 | $47,361 |
| Interquartile 75% (IQ3) | $87,517 | $73,101 |
| Interquartile Range (IQR) | $16,650 | $25,740 |
| Standard Deviation (Sample) | $22,039 | $24,968 |
| Standard Deviation (Population) | $21,858 | $24,608 |
Similar Demographics by Median Household Income
Demographics Similar to Immigrants from Venezuela by Median Household Income
In terms of median household income, the demographic groups most similar to Immigrants from Venezuela are Immigrants from Ghana ($81,489, a difference of 0.020%), Nigerian ($81,725, a difference of 0.27%), Immigrants from Nigeria ($81,236, a difference of 0.33%), Immigrants from El Salvador ($81,213, a difference of 0.36%), and Malaysian ($81,064, a difference of 0.54%).
| Demographics | Rating | Rank | Median Household Income |
| Nepalese | 15.1 /100 | #213 | Poor $82,410 |
| Panamanians | 14.0 /100 | #214 | Poor $82,272 |
| Vietnamese | 13.8 /100 | #215 | Poor $82,248 |
| Yugoslavians | 13.3 /100 | #216 | Poor $82,186 |
| Ecuadorians | 12.5 /100 | #217 | Poor $82,070 |
| Whites/Caucasians | 12.2 /100 | #218 | Poor $82,029 |
| Nigerians | 10.3 /100 | #219 | Poor $81,725 |
| Immigrants | Venezuela | 9.0 /100 | #220 | Tragic $81,506 |
| Immigrants | Ghana | 9.0 /100 | #221 | Tragic $81,489 |
| Immigrants | Nigeria | 7.7 /100 | #222 | Tragic $81,236 |
| Immigrants | El Salvador | 7.6 /100 | #223 | Tragic $81,213 |
| Malaysians | 7.0 /100 | #224 | Tragic $81,064 |
| Scotch-Irish | 6.6 /100 | #225 | Tragic $80,972 |
| Immigrants | Panama | 6.2 /100 | #226 | Tragic $80,873 |
| Guyanese | 5.7 /100 | #227 | Tragic $80,734 |
Demographics Similar to Paiute by Median Household Income
In terms of median household income, the demographic groups most similar to Paiute are Indonesian ($72,856, a difference of 0.14%), Immigrants from Mexico ($73,160, a difference of 0.27%), Immigrants from Dominica ($72,760, a difference of 0.27%), Cherokee ($72,682, a difference of 0.38%), and Shoshone ($72,660, a difference of 0.41%).
| Demographics | Rating | Rank | Median Household Income |
| Hispanics or Latinos | 0.1 /100 | #291 | Tragic $73,823 |
| Comanche | 0.1 /100 | #292 | Tragic $73,747 |
| Immigrants | Cabo Verde | 0.1 /100 | #293 | Tragic $73,515 |
| Blackfeet | 0.1 /100 | #294 | Tragic $73,509 |
| Cubans | 0.1 /100 | #295 | Tragic $73,392 |
| Haitians | 0.1 /100 | #296 | Tragic $73,306 |
| Immigrants | Mexico | 0.0 /100 | #297 | Tragic $73,160 |
| Paiute | 0.0 /100 | #298 | Tragic $72,959 |
| Indonesians | 0.0 /100 | #299 | Tragic $72,856 |
| Immigrants | Dominica | 0.0 /100 | #300 | Tragic $72,760 |
| Cherokee | 0.0 /100 | #301 | Tragic $72,682 |
| Shoshone | 0.0 /100 | #302 | Tragic $72,660 |
| Africans | 0.0 /100 | #303 | Tragic $72,650 |
| Immigrants | Haiti | 0.0 /100 | #304 | Tragic $72,599 |
| Hondurans | 0.0 /100 | #305 | Tragic $72,588 |