Sierra Leonean vs Paiute Median Household Income
COMPARE
Sierra Leonean
Paiute
Median Household Income
Median Household Income Comparison
Sierra Leoneans
Paiute
$88,463
MEDIAN HOUSEHOLD INCOME
89.6/ 100
METRIC RATING
137th/ 347
METRIC RANK
$72,959
MEDIAN HOUSEHOLD INCOME
0.0/ 100
METRIC RATING
298th/ 347
METRIC RANK
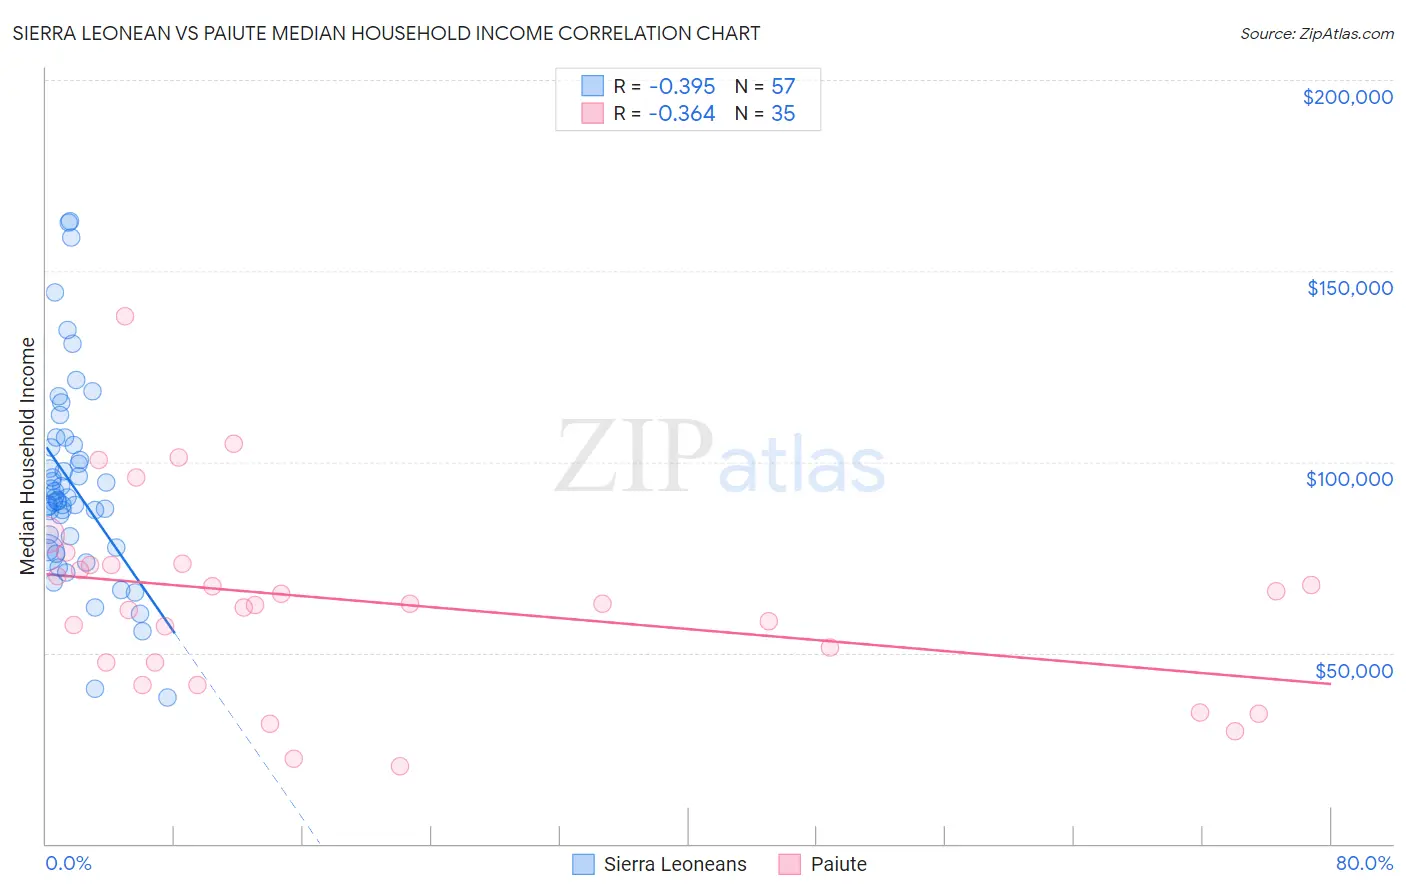
Sierra Leonean vs Paiute Median Household Income Correlation Chart
The statistical analysis conducted on geographies consisting of 83,336,605 people shows a mild negative correlation between the proportion of Sierra Leoneans and median household income in the United States with a correlation coefficient (R) of -0.395 and weighted average of $88,463. Similarly, the statistical analysis conducted on geographies consisting of 58,395,139 people shows a mild negative correlation between the proportion of Paiute and median household income in the United States with a correlation coefficient (R) of -0.364 and weighted average of $72,959, a difference of 21.2%.
Median Household Income Correlation Summary
| Measurement | Sierra Leonean | Paiute |
| Minimum | $38,207 | $20,139 |
| Maximum | $162,895 | $138,043 |
| Range | $124,688 | $117,904 |
| Mean | $93,657 | $63,163 |
| Median | $89,856 | $62,760 |
| Interquartile 25% (IQ1) | $77,308 | $47,361 |
| Interquartile 75% (IQ3) | $103,980 | $73,101 |
| Interquartile Range (IQR) | $26,672 | $25,740 |
| Standard Deviation (Sample) | $25,946 | $24,968 |
| Standard Deviation (Population) | $25,718 | $24,608 |
Similar Demographics by Median Household Income
Demographics Similar to Sierra Leoneans by Median Household Income
In terms of median household income, the demographic groups most similar to Sierra Leoneans are Polish ($88,472, a difference of 0.010%), Immigrants from Sierra Leone ($88,498, a difference of 0.040%), Swedish ($88,524, a difference of 0.070%), Arab ($88,398, a difference of 0.070%), and Immigrants from Chile ($88,388, a difference of 0.080%).
| Demographics | Rating | Rank | Median Household Income |
| British | 92.0 /100 | #130 | Exceptional $88,914 |
| Immigrants | Syria | 91.4 /100 | #131 | Exceptional $88,792 |
| Europeans | 91.2 /100 | #132 | Exceptional $88,751 |
| Immigrants | Ethiopia | 90.9 /100 | #133 | Exceptional $88,687 |
| Swedes | 90.0 /100 | #134 | Exceptional $88,524 |
| Immigrants | Sierra Leone | 89.9 /100 | #135 | Excellent $88,498 |
| Poles | 89.7 /100 | #136 | Excellent $88,472 |
| Sierra Leoneans | 89.6 /100 | #137 | Excellent $88,463 |
| Arabs | 89.2 /100 | #138 | Excellent $88,398 |
| Immigrants | Chile | 89.2 /100 | #139 | Excellent $88,388 |
| Lebanese | 87.2 /100 | #140 | Excellent $88,091 |
| Immigrants | Morocco | 86.0 /100 | #141 | Excellent $87,930 |
| Canadians | 84.7 /100 | #142 | Excellent $87,769 |
| Danes | 83.9 /100 | #143 | Excellent $87,676 |
| Serbians | 83.0 /100 | #144 | Excellent $87,572 |
Demographics Similar to Paiute by Median Household Income
In terms of median household income, the demographic groups most similar to Paiute are Indonesian ($72,856, a difference of 0.14%), Immigrants from Mexico ($73,160, a difference of 0.27%), Immigrants from Dominica ($72,760, a difference of 0.27%), Cherokee ($72,682, a difference of 0.38%), and Shoshone ($72,660, a difference of 0.41%).
| Demographics | Rating | Rank | Median Household Income |
| Hispanics or Latinos | 0.1 /100 | #291 | Tragic $73,823 |
| Comanche | 0.1 /100 | #292 | Tragic $73,747 |
| Immigrants | Cabo Verde | 0.1 /100 | #293 | Tragic $73,515 |
| Blackfeet | 0.1 /100 | #294 | Tragic $73,509 |
| Cubans | 0.1 /100 | #295 | Tragic $73,392 |
| Haitians | 0.1 /100 | #296 | Tragic $73,306 |
| Immigrants | Mexico | 0.0 /100 | #297 | Tragic $73,160 |
| Paiute | 0.0 /100 | #298 | Tragic $72,959 |
| Indonesians | 0.0 /100 | #299 | Tragic $72,856 |
| Immigrants | Dominica | 0.0 /100 | #300 | Tragic $72,760 |
| Cherokee | 0.0 /100 | #301 | Tragic $72,682 |
| Shoshone | 0.0 /100 | #302 | Tragic $72,660 |
| Africans | 0.0 /100 | #303 | Tragic $72,650 |
| Immigrants | Haiti | 0.0 /100 | #304 | Tragic $72,599 |
| Hondurans | 0.0 /100 | #305 | Tragic $72,588 |