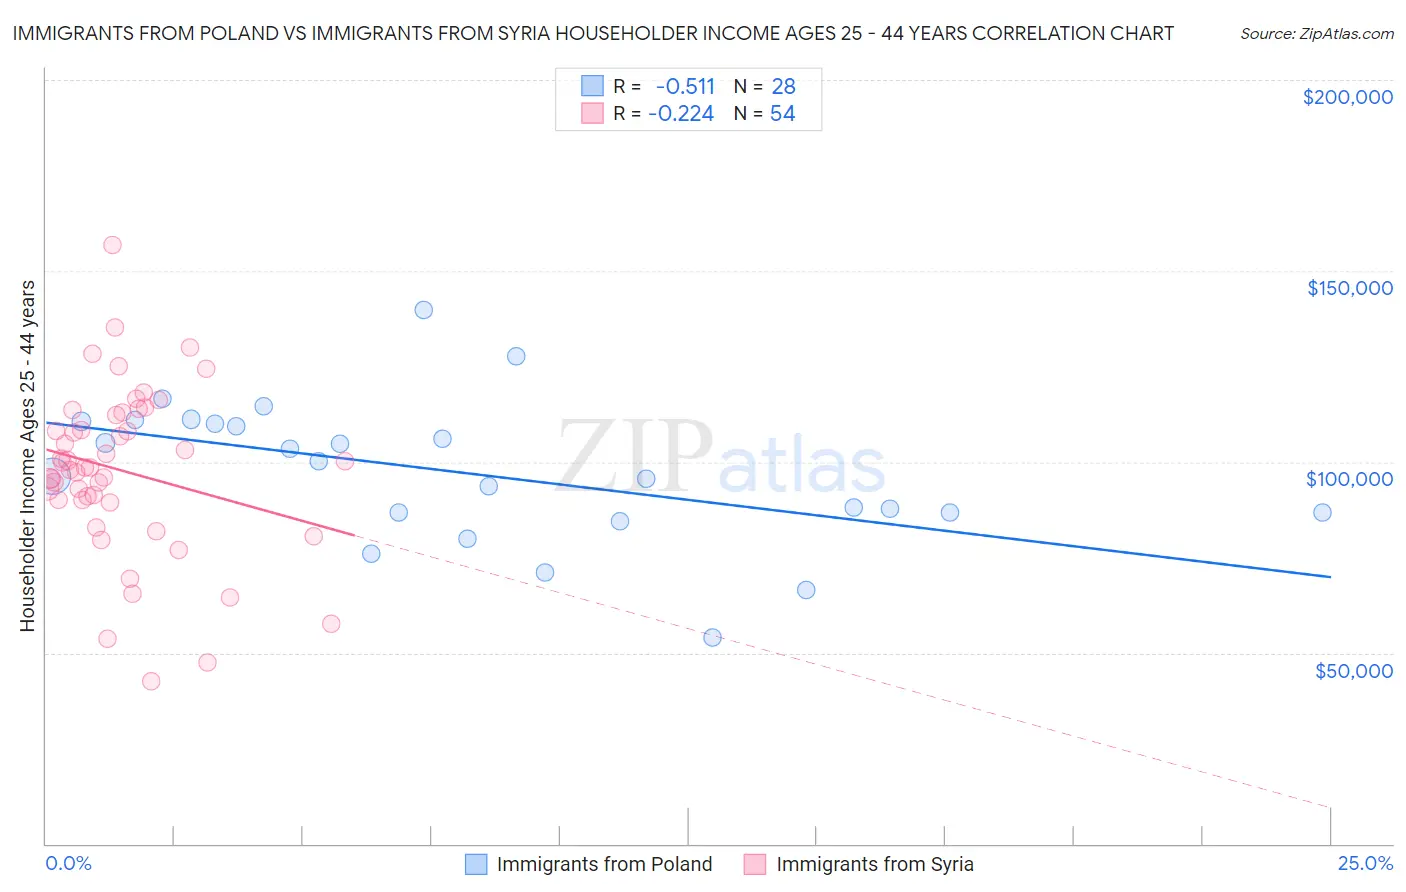
Immigrants from Poland vs Immigrants from Syria Householder Income Ages 25 - 44 years
COMPARE
Immigrants from Poland
Immigrants from Syria
Householder Income Ages 25 - 44 years
Householder Income Ages 25 - 44 years Comparison
Immigrants from Poland
Immigrants from Syria
$101,065
HOUSEHOLDER INCOME AGES 25 - 44 YEARS
97.4/ 100
METRIC RATING
104th/ 347
METRIC RANK
$96,789
HOUSEHOLDER INCOME AGES 25 - 44 YEARS
77.4/ 100
METRIC RATING
147th/ 347
METRIC RANK
Immigrants from Poland vs Immigrants from Syria Householder Income Ages 25 - 44 years Correlation Chart
The statistical analysis conducted on geographies consisting of 304,269,363 people shows a substantial negative correlation between the proportion of Immigrants from Poland and household income with householder between the ages 25 and 44 in the United States with a correlation coefficient (R) of -0.511 and weighted average of $101,065. Similarly, the statistical analysis conducted on geographies consisting of 174,044,447 people shows a weak negative correlation between the proportion of Immigrants from Syria and household income with householder between the ages 25 and 44 in the United States with a correlation coefficient (R) of -0.224 and weighted average of $96,789, a difference of 4.4%.
Householder Income Ages 25 - 44 years Correlation Summary
| Measurement | Immigrants from Poland | Immigrants from Syria |
| Minimum | $53,849 | $42,492 |
| Maximum | $139,903 | $156,643 |
| Range | $86,054 | $114,151 |
| Mean | $97,277 | $97,715 |
| Median | $98,174 | $98,566 |
| Interquartile 25% (IQ1) | $86,748 | $90,047 |
| Interquartile 75% (IQ3) | $110,162 | $112,269 |
| Interquartile Range (IQR) | $23,414 | $22,222 |
| Standard Deviation (Sample) | $18,764 | $21,833 |
| Standard Deviation (Population) | $18,426 | $21,629 |
Similar Demographics by Householder Income Ages 25 - 44 years
Demographics Similar to Immigrants from Poland by Householder Income Ages 25 - 44 years
In terms of householder income ages 25 - 44 years, the demographic groups most similar to Immigrants from Poland are Immigrants from Moldova ($101,091, a difference of 0.030%), Immigrants from Lebanon ($101,124, a difference of 0.060%), Albanian ($101,367, a difference of 0.30%), Immigrants from Argentina ($101,415, a difference of 0.35%), and Taiwanese ($101,492, a difference of 0.42%).
| Demographics | Rating | Rank | Householder Income Ages 25 - 44 years |
| Austrians | 98.3 /100 | #97 | Exceptional $101,842 |
| Immigrants | Kazakhstan | 98.1 /100 | #98 | Exceptional $101,727 |
| Taiwanese | 97.9 /100 | #99 | Exceptional $101,492 |
| Immigrants | Argentina | 97.8 /100 | #100 | Exceptional $101,415 |
| Albanians | 97.8 /100 | #101 | Exceptional $101,367 |
| Immigrants | Lebanon | 97.4 /100 | #102 | Exceptional $101,124 |
| Immigrants | Moldova | 97.4 /100 | #103 | Exceptional $101,091 |
| Immigrants | Poland | 97.4 /100 | #104 | Exceptional $101,065 |
| Immigrants | Vietnam | 96.5 /100 | #105 | Exceptional $100,535 |
| Immigrants | Brazil | 96.5 /100 | #106 | Exceptional $100,534 |
| Northern Europeans | 96.3 /100 | #107 | Exceptional $100,457 |
| Immigrants | South Eastern Asia | 96.0 /100 | #108 | Exceptional $100,283 |
| Immigrants | North Macedonia | 95.6 /100 | #109 | Exceptional $100,101 |
| Immigrants | Afghanistan | 95.3 /100 | #110 | Exceptional $99,977 |
| Chileans | 95.1 /100 | #111 | Exceptional $99,900 |
Demographics Similar to Immigrants from Syria by Householder Income Ages 25 - 44 years
In terms of householder income ages 25 - 44 years, the demographic groups most similar to Immigrants from Syria are Ethiopian ($96,824, a difference of 0.040%), Irish ($96,730, a difference of 0.060%), Norwegian ($96,866, a difference of 0.080%), Basque ($96,709, a difference of 0.080%), and Ugandan ($96,667, a difference of 0.13%).
| Demographics | Rating | Rank | Householder Income Ages 25 - 44 years |
| Immigrants | Morocco | 82.0 /100 | #140 | Excellent $97,305 |
| Luxembourgers | 81.5 /100 | #141 | Excellent $97,237 |
| Danes | 81.3 /100 | #142 | Excellent $97,221 |
| Immigrants | Jordan | 81.0 /100 | #143 | Excellent $97,185 |
| Immigrants | Chile | 80.8 /100 | #144 | Excellent $97,159 |
| Norwegians | 78.2 /100 | #145 | Good $96,866 |
| Ethiopians | 77.8 /100 | #146 | Good $96,824 |
| Immigrants | Syria | 77.4 /100 | #147 | Good $96,789 |
| Irish | 76.9 /100 | #148 | Good $96,730 |
| Basques | 76.6 /100 | #149 | Good $96,709 |
| Ugandans | 76.2 /100 | #150 | Good $96,667 |
| Czechs | 74.8 /100 | #151 | Good $96,525 |
| South American Indians | 74.5 /100 | #152 | Good $96,497 |
| Slovenes | 73.9 /100 | #153 | Good $96,439 |
| Slavs | 73.2 /100 | #154 | Good $96,377 |