Central American vs Immigrants from Syria Householder Income Ages 25 - 44 years
COMPARE
Central American
Immigrants from Syria
Householder Income Ages 25 - 44 years
Householder Income Ages 25 - 44 years Comparison
Central Americans
Immigrants from Syria
$85,144
HOUSEHOLDER INCOME AGES 25 - 44 YEARS
0.5/ 100
METRIC RATING
256th/ 347
METRIC RANK
$96,789
HOUSEHOLDER INCOME AGES 25 - 44 YEARS
77.4/ 100
METRIC RATING
147th/ 347
METRIC RANK
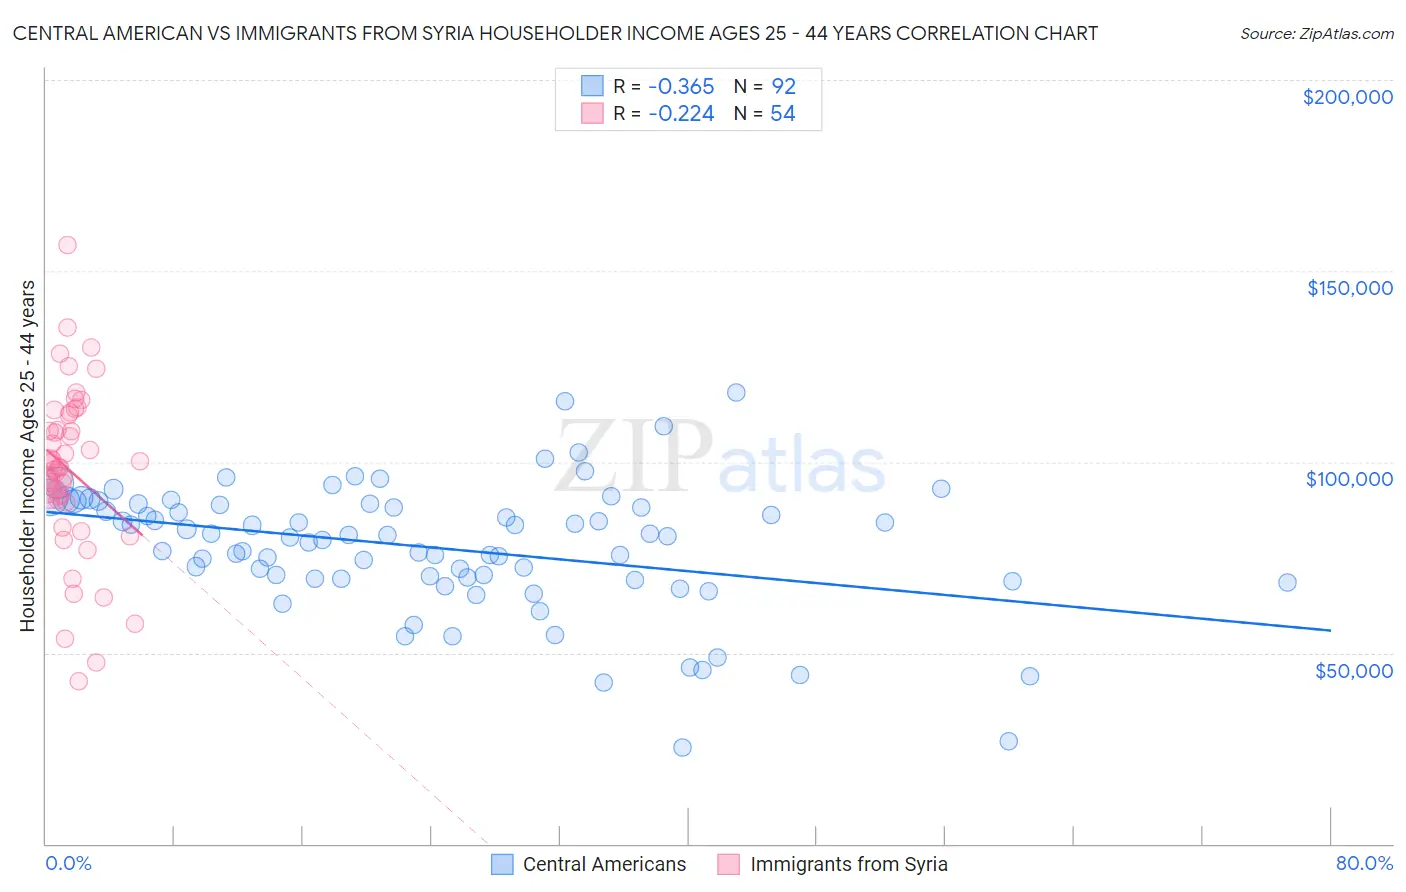
Central American vs Immigrants from Syria Householder Income Ages 25 - 44 years Correlation Chart
The statistical analysis conducted on geographies consisting of 502,385,785 people shows a mild negative correlation between the proportion of Central Americans and household income with householder between the ages 25 and 44 in the United States with a correlation coefficient (R) of -0.365 and weighted average of $85,144. Similarly, the statistical analysis conducted on geographies consisting of 174,044,447 people shows a weak negative correlation between the proportion of Immigrants from Syria and household income with householder between the ages 25 and 44 in the United States with a correlation coefficient (R) of -0.224 and weighted average of $96,789, a difference of 13.7%.
Householder Income Ages 25 - 44 years Correlation Summary
| Measurement | Central American | Immigrants from Syria |
| Minimum | $25,224 | $42,492 |
| Maximum | $118,125 | $156,643 |
| Range | $92,901 | $114,151 |
| Mean | $77,483 | $97,715 |
| Median | $80,487 | $98,566 |
| Interquartile 25% (IQ1) | $69,364 | $90,047 |
| Interquartile 75% (IQ3) | $88,864 | $112,269 |
| Interquartile Range (IQR) | $19,500 | $22,222 |
| Standard Deviation (Sample) | $16,910 | $21,833 |
| Standard Deviation (Population) | $16,818 | $21,629 |
Similar Demographics by Householder Income Ages 25 - 44 years
Demographics Similar to Central Americans by Householder Income Ages 25 - 44 years
In terms of householder income ages 25 - 44 years, the demographic groups most similar to Central Americans are German Russian ($85,220, a difference of 0.090%), Mexican American Indian ($85,066, a difference of 0.090%), Immigrants from Nicaragua ($84,914, a difference of 0.27%), Immigrants from Senegal ($84,848, a difference of 0.35%), and American ($84,791, a difference of 0.42%).
| Demographics | Rating | Rank | Householder Income Ages 25 - 44 years |
| French American Indians | 0.8 /100 | #249 | Tragic $85,899 |
| Pennsylvania Germans | 0.8 /100 | #250 | Tragic $85,836 |
| Cape Verdeans | 0.8 /100 | #251 | Tragic $85,758 |
| Immigrants | Western Africa | 0.7 /100 | #252 | Tragic $85,676 |
| British West Indians | 0.7 /100 | #253 | Tragic $85,565 |
| Immigrants | Laos | 0.7 /100 | #254 | Tragic $85,553 |
| German Russians | 0.6 /100 | #255 | Tragic $85,220 |
| Central Americans | 0.5 /100 | #256 | Tragic $85,144 |
| Mexican American Indians | 0.5 /100 | #257 | Tragic $85,066 |
| Immigrants | Nicaragua | 0.5 /100 | #258 | Tragic $84,914 |
| Immigrants | Senegal | 0.5 /100 | #259 | Tragic $84,848 |
| Americans | 0.4 /100 | #260 | Tragic $84,791 |
| Inupiat | 0.4 /100 | #261 | Tragic $84,619 |
| Cree | 0.4 /100 | #262 | Tragic $84,574 |
| Belizeans | 0.4 /100 | #263 | Tragic $84,534 |
Demographics Similar to Immigrants from Syria by Householder Income Ages 25 - 44 years
In terms of householder income ages 25 - 44 years, the demographic groups most similar to Immigrants from Syria are Ethiopian ($96,824, a difference of 0.040%), Irish ($96,730, a difference of 0.060%), Norwegian ($96,866, a difference of 0.080%), Basque ($96,709, a difference of 0.080%), and Ugandan ($96,667, a difference of 0.13%).
| Demographics | Rating | Rank | Householder Income Ages 25 - 44 years |
| Immigrants | Morocco | 82.0 /100 | #140 | Excellent $97,305 |
| Luxembourgers | 81.5 /100 | #141 | Excellent $97,237 |
| Danes | 81.3 /100 | #142 | Excellent $97,221 |
| Immigrants | Jordan | 81.0 /100 | #143 | Excellent $97,185 |
| Immigrants | Chile | 80.8 /100 | #144 | Excellent $97,159 |
| Norwegians | 78.2 /100 | #145 | Good $96,866 |
| Ethiopians | 77.8 /100 | #146 | Good $96,824 |
| Immigrants | Syria | 77.4 /100 | #147 | Good $96,789 |
| Irish | 76.9 /100 | #148 | Good $96,730 |
| Basques | 76.6 /100 | #149 | Good $96,709 |
| Ugandans | 76.2 /100 | #150 | Good $96,667 |
| Czechs | 74.8 /100 | #151 | Good $96,525 |
| South American Indians | 74.5 /100 | #152 | Good $96,497 |
| Slovenes | 73.9 /100 | #153 | Good $96,439 |
| Slavs | 73.2 /100 | #154 | Good $96,377 |