Immigrants from Poland vs Immigrants from El Salvador Householder Income Ages 25 - 44 years
COMPARE
Immigrants from Poland
Immigrants from El Salvador
Householder Income Ages 25 - 44 years
Householder Income Ages 25 - 44 years Comparison
Immigrants from Poland
Immigrants from El Salvador
$101,065
HOUSEHOLDER INCOME AGES 25 - 44 YEARS
97.4/ 100
METRIC RATING
104th/ 347
METRIC RANK
$86,913
HOUSEHOLDER INCOME AGES 25 - 44 YEARS
1.4/ 100
METRIC RATING
245th/ 347
METRIC RANK
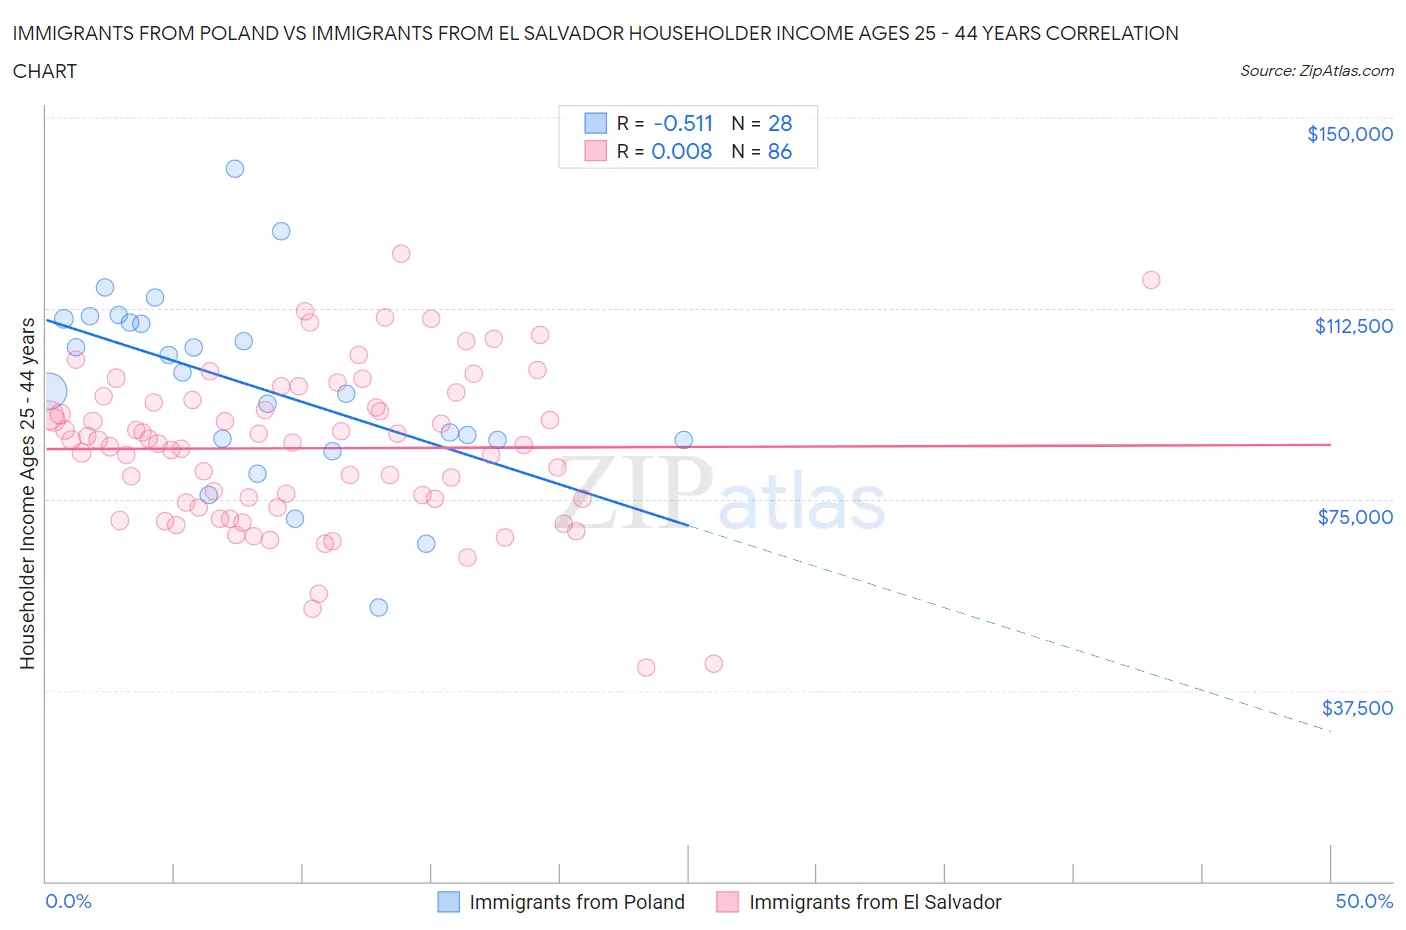
Immigrants from Poland vs Immigrants from El Salvador Householder Income Ages 25 - 44 years Correlation Chart
The statistical analysis conducted on geographies consisting of 304,269,363 people shows a substantial negative correlation between the proportion of Immigrants from Poland and household income with householder between the ages 25 and 44 in the United States with a correlation coefficient (R) of -0.511 and weighted average of $101,065. Similarly, the statistical analysis conducted on geographies consisting of 357,268,727 people shows no correlation between the proportion of Immigrants from El Salvador and household income with householder between the ages 25 and 44 in the United States with a correlation coefficient (R) of 0.008 and weighted average of $86,913, a difference of 16.3%.
Householder Income Ages 25 - 44 years Correlation Summary
| Measurement | Immigrants from Poland | Immigrants from El Salvador |
| Minimum | $53,849 | $41,962 |
| Maximum | $139,903 | $123,232 |
| Range | $86,054 | $81,270 |
| Mean | $97,277 | $85,059 |
| Median | $98,174 | $86,368 |
| Interquartile 25% (IQ1) | $86,748 | $74,423 |
| Interquartile 75% (IQ3) | $110,162 | $94,628 |
| Interquartile Range (IQR) | $23,414 | $20,205 |
| Standard Deviation (Sample) | $18,764 | $15,431 |
| Standard Deviation (Population) | $18,426 | $15,341 |
Similar Demographics by Householder Income Ages 25 - 44 years
Demographics Similar to Immigrants from Poland by Householder Income Ages 25 - 44 years
In terms of householder income ages 25 - 44 years, the demographic groups most similar to Immigrants from Poland are Immigrants from Moldova ($101,091, a difference of 0.030%), Immigrants from Lebanon ($101,124, a difference of 0.060%), Albanian ($101,367, a difference of 0.30%), Immigrants from Argentina ($101,415, a difference of 0.35%), and Taiwanese ($101,492, a difference of 0.42%).
| Demographics | Rating | Rank | Householder Income Ages 25 - 44 years |
| Austrians | 98.3 /100 | #97 | Exceptional $101,842 |
| Immigrants | Kazakhstan | 98.1 /100 | #98 | Exceptional $101,727 |
| Taiwanese | 97.9 /100 | #99 | Exceptional $101,492 |
| Immigrants | Argentina | 97.8 /100 | #100 | Exceptional $101,415 |
| Albanians | 97.8 /100 | #101 | Exceptional $101,367 |
| Immigrants | Lebanon | 97.4 /100 | #102 | Exceptional $101,124 |
| Immigrants | Moldova | 97.4 /100 | #103 | Exceptional $101,091 |
| Immigrants | Poland | 97.4 /100 | #104 | Exceptional $101,065 |
| Immigrants | Vietnam | 96.5 /100 | #105 | Exceptional $100,535 |
| Immigrants | Brazil | 96.5 /100 | #106 | Exceptional $100,534 |
| Northern Europeans | 96.3 /100 | #107 | Exceptional $100,457 |
| Immigrants | South Eastern Asia | 96.0 /100 | #108 | Exceptional $100,283 |
| Immigrants | North Macedonia | 95.6 /100 | #109 | Exceptional $100,101 |
| Immigrants | Afghanistan | 95.3 /100 | #110 | Exceptional $99,977 |
| Chileans | 95.1 /100 | #111 | Exceptional $99,900 |
Demographics Similar to Immigrants from El Salvador by Householder Income Ages 25 - 44 years
In terms of householder income ages 25 - 44 years, the demographic groups most similar to Immigrants from El Salvador are Immigrants from Venezuela ($87,038, a difference of 0.14%), Immigrants from West Indies ($87,063, a difference of 0.17%), Immigrants from Burma/Myanmar ($86,736, a difference of 0.20%), West Indian ($87,205, a difference of 0.34%), and Immigrants from Nigeria ($86,589, a difference of 0.37%).
| Demographics | Rating | Rank | Householder Income Ages 25 - 44 years |
| Alaska Natives | 2.6 /100 | #238 | Tragic $88,018 |
| Immigrants | Ghana | 2.2 /100 | #239 | Tragic $87,760 |
| Nicaraguans | 2.2 /100 | #240 | Tragic $87,751 |
| Nigerians | 2.2 /100 | #241 | Tragic $87,730 |
| West Indians | 1.7 /100 | #242 | Tragic $87,205 |
| Immigrants | West Indies | 1.5 /100 | #243 | Tragic $87,063 |
| Immigrants | Venezuela | 1.5 /100 | #244 | Tragic $87,038 |
| Immigrants | El Salvador | 1.4 /100 | #245 | Tragic $86,913 |
| Immigrants | Burma/Myanmar | 1.3 /100 | #246 | Tragic $86,736 |
| Immigrants | Nigeria | 1.2 /100 | #247 | Tragic $86,589 |
| Immigrants | Sudan | 0.9 /100 | #248 | Tragic $86,109 |
| French American Indians | 0.8 /100 | #249 | Tragic $85,899 |
| Pennsylvania Germans | 0.8 /100 | #250 | Tragic $85,836 |
| Cape Verdeans | 0.8 /100 | #251 | Tragic $85,758 |
| Immigrants | Western Africa | 0.7 /100 | #252 | Tragic $85,676 |