Immigrants from Poland vs Immigrants from Syria Female Poverty Among 25-34 Year Olds
COMPARE
Immigrants from Poland
Immigrants from Syria
Female Poverty Among 25-34 Year Olds
Female Poverty Among 25-34 Year Olds Comparison
Immigrants from Poland
Immigrants from Syria
11.6%
FEMALE POVERTY AMONG 25-34 YEAR OLDS
99.9/ 100
METRIC RATING
33rd/ 347
METRIC RANK
12.8%
FEMALE POVERTY AMONG 25-34 YEAR OLDS
93.8/ 100
METRIC RATING
113th/ 347
METRIC RANK
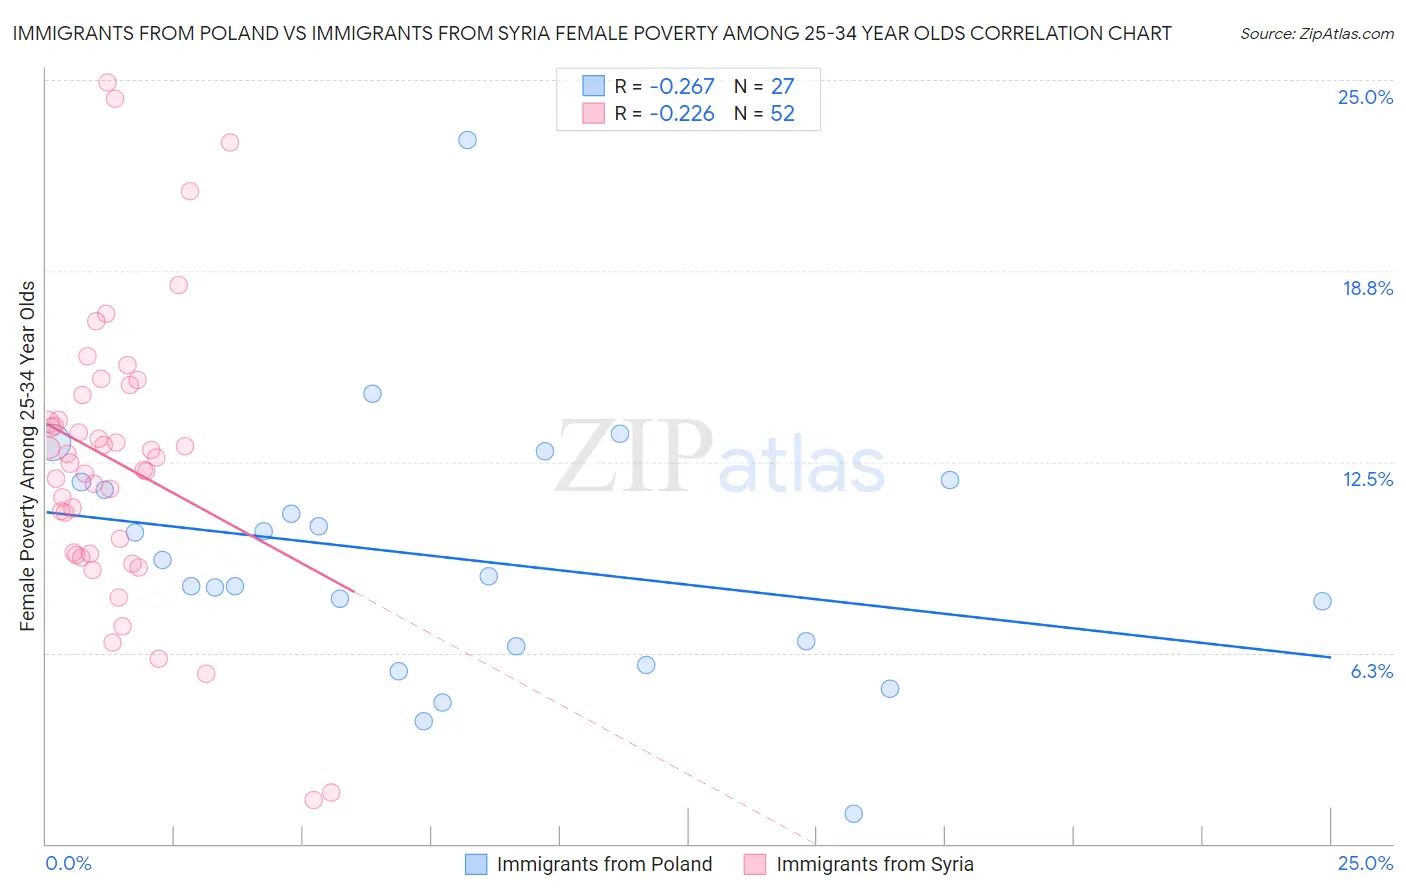
Immigrants from Poland vs Immigrants from Syria Female Poverty Among 25-34 Year Olds Correlation Chart
The statistical analysis conducted on geographies consisting of 299,264,805 people shows a weak negative correlation between the proportion of Immigrants from Poland and poverty level among females between the ages 25 and 34 in the United States with a correlation coefficient (R) of -0.267 and weighted average of 11.6%. Similarly, the statistical analysis conducted on geographies consisting of 173,105,379 people shows a weak negative correlation between the proportion of Immigrants from Syria and poverty level among females between the ages 25 and 34 in the United States with a correlation coefficient (R) of -0.226 and weighted average of 12.8%, a difference of 9.7%.
Female Poverty Among 25-34 Year Olds Correlation Summary
| Measurement | Immigrants from Poland | Immigrants from Syria |
| Minimum | 0.98% | 1.4% |
| Maximum | 23.1% | 24.9% |
| Range | 22.1% | 23.5% |
| Mean | 9.4% | 12.5% |
| Median | 8.8% | 12.6% |
| Interquartile 25% (IQ1) | 6.5% | 9.5% |
| Interquartile 75% (IQ3) | 11.8% | 14.3% |
| Interquartile Range (IQR) | 5.4% | 4.8% |
| Standard Deviation (Sample) | 4.3% | 4.7% |
| Standard Deviation (Population) | 4.2% | 4.6% |
Similar Demographics by Female Poverty Among 25-34 Year Olds
Demographics Similar to Immigrants from Poland by Female Poverty Among 25-34 Year Olds
In terms of female poverty among 25-34 year olds, the demographic groups most similar to Immigrants from Poland are Zimbabwean (11.7%, a difference of 0.22%), Immigrants from Asia (11.6%, a difference of 0.35%), Cambodian (11.7%, a difference of 0.49%), Immigrants from Japan (11.6%, a difference of 0.65%), and Cypriot (11.5%, a difference of 0.94%).
| Demographics | Rating | Rank | Female Poverty Among 25-34 Year Olds |
| Tongans | 99.9 /100 | #26 | Exceptional 11.5% |
| Immigrants | Greece | 99.9 /100 | #27 | Exceptional 11.5% |
| Immigrants | Pakistan | 99.9 /100 | #28 | Exceptional 11.5% |
| Bulgarians | 99.9 /100 | #29 | Exceptional 11.5% |
| Cypriots | 99.9 /100 | #30 | Exceptional 11.5% |
| Immigrants | Japan | 99.9 /100 | #31 | Exceptional 11.6% |
| Immigrants | Asia | 99.9 /100 | #32 | Exceptional 11.6% |
| Immigrants | Poland | 99.9 /100 | #33 | Exceptional 11.6% |
| Zimbabweans | 99.9 /100 | #34 | Exceptional 11.7% |
| Cambodians | 99.9 /100 | #35 | Exceptional 11.7% |
| Immigrants | Sri Lanka | 99.8 /100 | #36 | Exceptional 11.8% |
| Taiwanese | 99.8 /100 | #37 | Exceptional 11.8% |
| Immigrants | North Macedonia | 99.8 /100 | #38 | Exceptional 11.8% |
| Latvians | 99.8 /100 | #39 | Exceptional 11.8% |
| Immigrants | Bulgaria | 99.8 /100 | #40 | Exceptional 11.8% |
Demographics Similar to Immigrants from Syria by Female Poverty Among 25-34 Year Olds
In terms of female poverty among 25-34 year olds, the demographic groups most similar to Immigrants from Syria are Immigrants from Morocco (12.8%, a difference of 0.040%), Danish (12.8%, a difference of 0.060%), Immigrants from Southern Europe (12.8%, a difference of 0.070%), Australian (12.8%, a difference of 0.13%), and Immigrants from Brazil (12.8%, a difference of 0.16%).
| Demographics | Rating | Rank | Female Poverty Among 25-34 Year Olds |
| Tsimshian | 95.1 /100 | #106 | Exceptional 12.7% |
| Poles | 94.9 /100 | #107 | Exceptional 12.7% |
| Immigrants | Norway | 94.4 /100 | #108 | Exceptional 12.7% |
| Immigrants | Peru | 94.3 /100 | #109 | Exceptional 12.7% |
| Australians | 94.1 /100 | #110 | Exceptional 12.8% |
| Danes | 93.9 /100 | #111 | Exceptional 12.8% |
| Immigrants | Morocco | 93.9 /100 | #112 | Exceptional 12.8% |
| Immigrants | Syria | 93.8 /100 | #113 | Exceptional 12.8% |
| Immigrants | Southern Europe | 93.6 /100 | #114 | Exceptional 12.8% |
| Immigrants | Brazil | 93.3 /100 | #115 | Exceptional 12.8% |
| Chileans | 93.2 /100 | #116 | Exceptional 12.8% |
| Immigrants | Kuwait | 93.1 /100 | #117 | Exceptional 12.8% |
| Mongolians | 93.0 /100 | #118 | Exceptional 12.8% |
| Immigrants | Nepal | 93.0 /100 | #119 | Exceptional 12.8% |
| Carpatho Rusyns | 93.0 /100 | #120 | Exceptional 12.8% |