Immigrants from Poland vs Immigrants from China Householder Income Ages 25 - 44 years
COMPARE
Immigrants from Poland
Immigrants from China
Householder Income Ages 25 - 44 years
Householder Income Ages 25 - 44 years Comparison
Immigrants from Poland
Immigrants from China
$101,065
HOUSEHOLDER INCOME AGES 25 - 44 YEARS
97.4/ 100
METRIC RATING
104th/ 347
METRIC RANK
$119,756
HOUSEHOLDER INCOME AGES 25 - 44 YEARS
100.0/ 100
METRIC RATING
9th/ 347
METRIC RANK
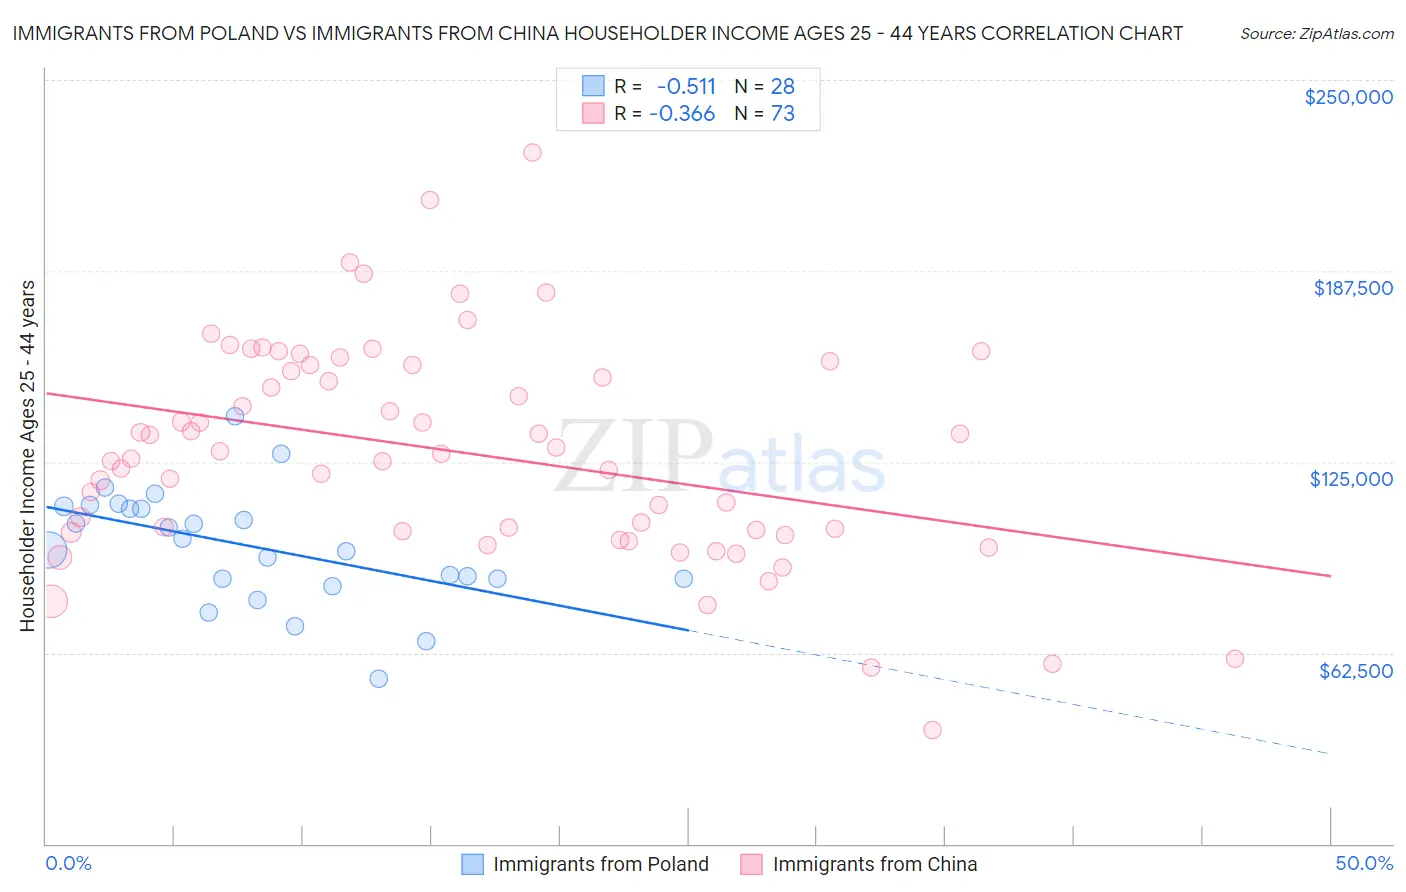
Immigrants from Poland vs Immigrants from China Householder Income Ages 25 - 44 years Correlation Chart
The statistical analysis conducted on geographies consisting of 304,269,363 people shows a substantial negative correlation between the proportion of Immigrants from Poland and household income with householder between the ages 25 and 44 in the United States with a correlation coefficient (R) of -0.511 and weighted average of $101,065. Similarly, the statistical analysis conducted on geographies consisting of 455,414,350 people shows a mild negative correlation between the proportion of Immigrants from China and household income with householder between the ages 25 and 44 in the United States with a correlation coefficient (R) of -0.366 and weighted average of $119,756, a difference of 18.5%.
Householder Income Ages 25 - 44 years Correlation Summary
| Measurement | Immigrants from Poland | Immigrants from China |
| Minimum | $53,849 | $37,292 |
| Maximum | $139,903 | $226,084 |
| Range | $86,054 | $188,792 |
| Mean | $97,277 | $128,177 |
| Median | $98,174 | $127,614 |
| Interquartile 25% (IQ1) | $86,748 | $101,947 |
| Interquartile 75% (IQ3) | $110,162 | $156,639 |
| Interquartile Range (IQR) | $23,414 | $54,692 |
| Standard Deviation (Sample) | $18,764 | $35,872 |
| Standard Deviation (Population) | $18,426 | $35,626 |
Similar Demographics by Householder Income Ages 25 - 44 years
Demographics Similar to Immigrants from Poland by Householder Income Ages 25 - 44 years
In terms of householder income ages 25 - 44 years, the demographic groups most similar to Immigrants from Poland are Immigrants from Moldova ($101,091, a difference of 0.030%), Immigrants from Lebanon ($101,124, a difference of 0.060%), Albanian ($101,367, a difference of 0.30%), Immigrants from Argentina ($101,415, a difference of 0.35%), and Taiwanese ($101,492, a difference of 0.42%).
| Demographics | Rating | Rank | Householder Income Ages 25 - 44 years |
| Austrians | 98.3 /100 | #97 | Exceptional $101,842 |
| Immigrants | Kazakhstan | 98.1 /100 | #98 | Exceptional $101,727 |
| Taiwanese | 97.9 /100 | #99 | Exceptional $101,492 |
| Immigrants | Argentina | 97.8 /100 | #100 | Exceptional $101,415 |
| Albanians | 97.8 /100 | #101 | Exceptional $101,367 |
| Immigrants | Lebanon | 97.4 /100 | #102 | Exceptional $101,124 |
| Immigrants | Moldova | 97.4 /100 | #103 | Exceptional $101,091 |
| Immigrants | Poland | 97.4 /100 | #104 | Exceptional $101,065 |
| Immigrants | Vietnam | 96.5 /100 | #105 | Exceptional $100,535 |
| Immigrants | Brazil | 96.5 /100 | #106 | Exceptional $100,534 |
| Northern Europeans | 96.3 /100 | #107 | Exceptional $100,457 |
| Immigrants | South Eastern Asia | 96.0 /100 | #108 | Exceptional $100,283 |
| Immigrants | North Macedonia | 95.6 /100 | #109 | Exceptional $100,101 |
| Immigrants | Afghanistan | 95.3 /100 | #110 | Exceptional $99,977 |
| Chileans | 95.1 /100 | #111 | Exceptional $99,900 |
Demographics Similar to Immigrants from China by Householder Income Ages 25 - 44 years
In terms of householder income ages 25 - 44 years, the demographic groups most similar to Immigrants from China are Indian (Asian) ($119,496, a difference of 0.22%), Okinawan ($119,349, a difference of 0.34%), Iranian ($120,292, a difference of 0.45%), Immigrants from Iran ($119,204, a difference of 0.46%), and Immigrants from Ireland ($120,333, a difference of 0.48%).
| Demographics | Rating | Rank | Householder Income Ages 25 - 44 years |
| Filipinos | 100.0 /100 | #2 | Exceptional $128,723 |
| Immigrants | Hong Kong | 100.0 /100 | #3 | Exceptional $128,140 |
| Immigrants | Singapore | 100.0 /100 | #4 | Exceptional $124,429 |
| Immigrants | India | 100.0 /100 | #5 | Exceptional $124,238 |
| Thais | 100.0 /100 | #6 | Exceptional $121,778 |
| Immigrants | Ireland | 100.0 /100 | #7 | Exceptional $120,333 |
| Iranians | 100.0 /100 | #8 | Exceptional $120,292 |
| Immigrants | China | 100.0 /100 | #9 | Exceptional $119,756 |
| Indians (Asian) | 100.0 /100 | #10 | Exceptional $119,496 |
| Okinawans | 100.0 /100 | #11 | Exceptional $119,349 |
| Immigrants | Iran | 100.0 /100 | #12 | Exceptional $119,204 |
| Immigrants | Eastern Asia | 100.0 /100 | #13 | Exceptional $118,056 |
| Immigrants | Israel | 100.0 /100 | #14 | Exceptional $117,219 |
| Immigrants | South Central Asia | 100.0 /100 | #15 | Exceptional $116,626 |
| Cypriots | 100.0 /100 | #16 | Exceptional $116,364 |