Afghan vs Houma Householder Income Ages 25 - 44 years
COMPARE
Afghan
Houma
Householder Income Ages 25 - 44 years
Householder Income Ages 25 - 44 years Comparison
Afghans
Houma
$104,410
HOUSEHOLDER INCOME AGES 25 - 44 YEARS
99.6/ 100
METRIC RATING
71st/ 347
METRIC RANK
$77,044
HOUSEHOLDER INCOME AGES 25 - 44 YEARS
0.0/ 100
METRIC RATING
326th/ 347
METRIC RANK
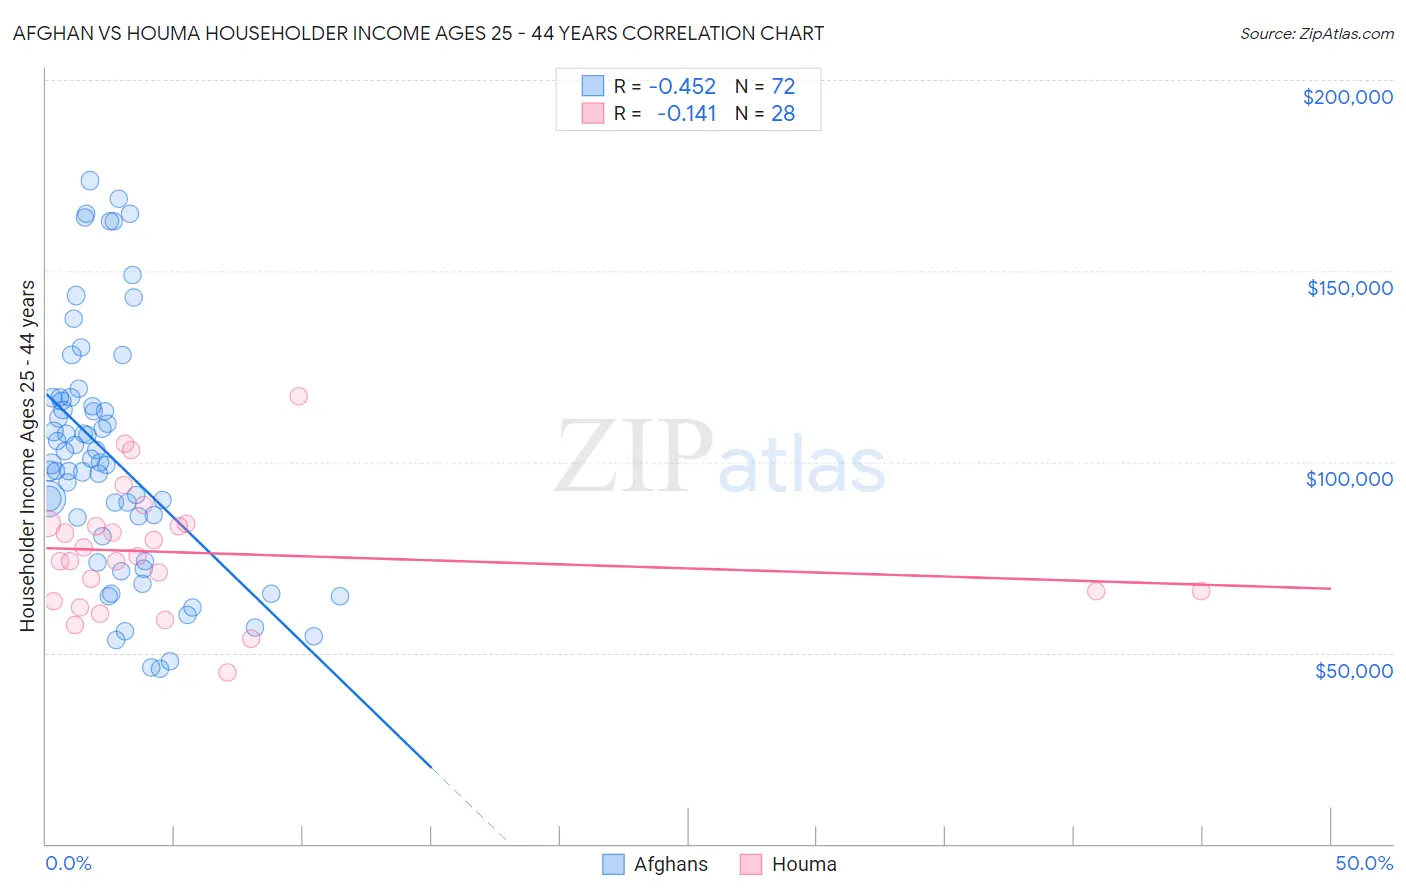
Afghan vs Houma Householder Income Ages 25 - 44 years Correlation Chart
The statistical analysis conducted on geographies consisting of 148,765,524 people shows a moderate negative correlation between the proportion of Afghans and household income with householder between the ages 25 and 44 in the United States with a correlation coefficient (R) of -0.452 and weighted average of $104,410. Similarly, the statistical analysis conducted on geographies consisting of 36,744,797 people shows a poor negative correlation between the proportion of Houma and household income with householder between the ages 25 and 44 in the United States with a correlation coefficient (R) of -0.141 and weighted average of $77,044, a difference of 35.5%.
Householder Income Ages 25 - 44 years Correlation Summary
| Measurement | Afghan | Houma |
| Minimum | $45,809 | $44,839 |
| Maximum | $173,653 | $117,083 |
| Range | $127,844 | $72,244 |
| Mean | $101,372 | $76,117 |
| Median | $99,588 | $74,711 |
| Interquartile 25% (IQ1) | $77,205 | $64,767 |
| Interquartile 75% (IQ3) | $116,400 | $83,511 |
| Interquartile Range (IQR) | $39,195 | $18,745 |
| Standard Deviation (Sample) | $32,218 | $16,133 |
| Standard Deviation (Population) | $31,993 | $15,843 |
Similar Demographics by Householder Income Ages 25 - 44 years
Demographics Similar to Afghans by Householder Income Ages 25 - 44 years
In terms of householder income ages 25 - 44 years, the demographic groups most similar to Afghans are Immigrants from Croatia ($104,503, a difference of 0.090%), Chinese ($104,264, a difference of 0.14%), Mongolian ($104,578, a difference of 0.16%), Italian ($104,215, a difference of 0.19%), and Immigrants from Eastern Europe ($104,662, a difference of 0.24%).
| Demographics | Rating | Rank | Householder Income Ages 25 - 44 years |
| New Zealanders | 99.7 /100 | #64 | Exceptional $105,085 |
| Immigrants | Netherlands | 99.7 /100 | #65 | Exceptional $105,082 |
| Laotians | 99.7 /100 | #66 | Exceptional $104,993 |
| Immigrants | Romania | 99.6 /100 | #67 | Exceptional $104,713 |
| Immigrants | Eastern Europe | 99.6 /100 | #68 | Exceptional $104,662 |
| Mongolians | 99.6 /100 | #69 | Exceptional $104,578 |
| Immigrants | Croatia | 99.6 /100 | #70 | Exceptional $104,503 |
| Afghans | 99.6 /100 | #71 | Exceptional $104,410 |
| Chinese | 99.5 /100 | #72 | Exceptional $104,264 |
| Italians | 99.5 /100 | #73 | Exceptional $104,215 |
| Immigrants | Fiji | 99.5 /100 | #74 | Exceptional $103,954 |
| Koreans | 99.4 /100 | #75 | Exceptional $103,824 |
| Immigrants | Spain | 99.4 /100 | #76 | Exceptional $103,752 |
| Immigrants | Southern Europe | 99.3 /100 | #77 | Exceptional $103,486 |
| Immigrants | Bulgaria | 99.3 /100 | #78 | Exceptional $103,423 |
Demographics Similar to Houma by Householder Income Ages 25 - 44 years
In terms of householder income ages 25 - 44 years, the demographic groups most similar to Houma are Sioux ($77,089, a difference of 0.060%), Immigrants from Bahamas ($76,910, a difference of 0.17%), Dutch West Indian ($77,260, a difference of 0.28%), Immigrants from Honduras ($77,328, a difference of 0.37%), and Immigrants from Cuba ($76,701, a difference of 0.45%).
| Demographics | Rating | Rank | Householder Income Ages 25 - 44 years |
| Hondurans | 0.0 /100 | #319 | Tragic $78,540 |
| Choctaw | 0.0 /100 | #320 | Tragic $78,168 |
| Immigrants | Zaire | 0.0 /100 | #321 | Tragic $78,045 |
| Chickasaw | 0.0 /100 | #322 | Tragic $77,929 |
| Immigrants | Honduras | 0.0 /100 | #323 | Tragic $77,328 |
| Dutch West Indians | 0.0 /100 | #324 | Tragic $77,260 |
| Sioux | 0.0 /100 | #325 | Tragic $77,089 |
| Houma | 0.0 /100 | #326 | Tragic $77,044 |
| Immigrants | Bahamas | 0.0 /100 | #327 | Tragic $76,910 |
| Immigrants | Cuba | 0.0 /100 | #328 | Tragic $76,701 |
| Seminole | 0.0 /100 | #329 | Tragic $76,584 |
| Yakama | 0.0 /100 | #330 | Tragic $76,226 |
| Natives/Alaskans | 0.0 /100 | #331 | Tragic $75,647 |
| Bahamians | 0.0 /100 | #332 | Tragic $75,395 |
| Hopi | 0.0 /100 | #333 | Tragic $75,002 |