Immigrants from Oceania vs Houma Householder Income Ages 25 - 44 years
COMPARE
Immigrants from Oceania
Houma
Householder Income Ages 25 - 44 years
Householder Income Ages 25 - 44 years Comparison
Immigrants from Oceania
Houma
$97,623
HOUSEHOLDER INCOME AGES 25 - 44 YEARS
84.5/ 100
METRIC RATING
135th/ 347
METRIC RANK
$77,044
HOUSEHOLDER INCOME AGES 25 - 44 YEARS
0.0/ 100
METRIC RATING
326th/ 347
METRIC RANK
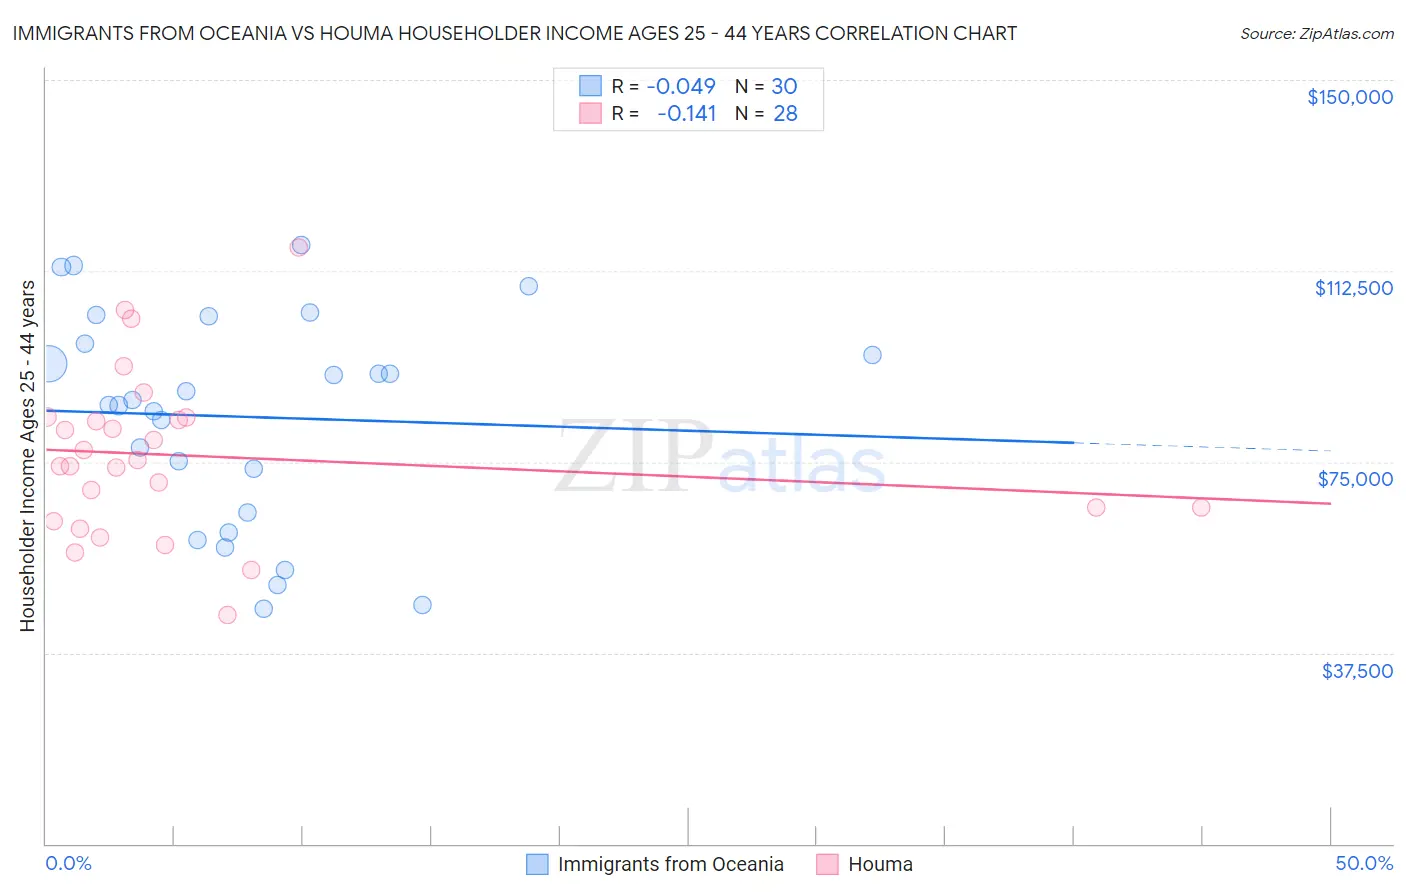
Immigrants from Oceania vs Houma Householder Income Ages 25 - 44 years Correlation Chart
The statistical analysis conducted on geographies consisting of 305,010,299 people shows no correlation between the proportion of Immigrants from Oceania and household income with householder between the ages 25 and 44 in the United States with a correlation coefficient (R) of -0.049 and weighted average of $97,623. Similarly, the statistical analysis conducted on geographies consisting of 36,744,797 people shows a poor negative correlation between the proportion of Houma and household income with householder between the ages 25 and 44 in the United States with a correlation coefficient (R) of -0.141 and weighted average of $77,044, a difference of 26.7%.
Householder Income Ages 25 - 44 years Correlation Summary
| Measurement | Immigrants from Oceania | Houma |
| Minimum | $46,211 | $44,839 |
| Maximum | $117,593 | $117,083 |
| Range | $71,381 | $72,244 |
| Mean | $83,848 | $76,117 |
| Median | $86,701 | $74,711 |
| Interquartile 25% (IQ1) | $65,112 | $64,767 |
| Interquartile 75% (IQ3) | $98,105 | $83,511 |
| Interquartile Range (IQR) | $32,993 | $18,745 |
| Standard Deviation (Sample) | $20,832 | $16,133 |
| Standard Deviation (Population) | $20,482 | $15,843 |
Similar Demographics by Householder Income Ages 25 - 44 years
Demographics Similar to Immigrants from Oceania by Householder Income Ages 25 - 44 years
In terms of householder income ages 25 - 44 years, the demographic groups most similar to Immigrants from Oceania are Canadian ($97,625, a difference of 0.0%), Hungarian ($97,544, a difference of 0.080%), Tsimshian ($97,809, a difference of 0.19%), Immigrants from Zimbabwe ($97,880, a difference of 0.26%), and Lebanese ($97,339, a difference of 0.29%).
| Demographics | Rating | Rank | Householder Income Ages 25 - 44 years |
| Europeans | 88.9 /100 | #128 | Excellent $98,310 |
| Brazilians | 88.6 /100 | #129 | Excellent $98,267 |
| Immigrants | Kuwait | 87.8 /100 | #130 | Excellent $98,122 |
| Immigrants | Albania | 86.6 /100 | #131 | Excellent $97,929 |
| Immigrants | Zimbabwe | 86.3 /100 | #132 | Excellent $97,880 |
| Tsimshian | 85.8 /100 | #133 | Excellent $97,809 |
| Canadians | 84.5 /100 | #134 | Excellent $97,625 |
| Immigrants | Oceania | 84.5 /100 | #135 | Excellent $97,623 |
| Hungarians | 83.9 /100 | #136 | Excellent $97,544 |
| Lebanese | 82.3 /100 | #137 | Excellent $97,339 |
| Arabs | 82.3 /100 | #138 | Excellent $97,336 |
| Immigrants | Peru | 82.2 /100 | #139 | Excellent $97,329 |
| Immigrants | Morocco | 82.0 /100 | #140 | Excellent $97,305 |
| Luxembourgers | 81.5 /100 | #141 | Excellent $97,237 |
| Danes | 81.3 /100 | #142 | Excellent $97,221 |
Demographics Similar to Houma by Householder Income Ages 25 - 44 years
In terms of householder income ages 25 - 44 years, the demographic groups most similar to Houma are Sioux ($77,089, a difference of 0.060%), Immigrants from Bahamas ($76,910, a difference of 0.17%), Dutch West Indian ($77,260, a difference of 0.28%), Immigrants from Honduras ($77,328, a difference of 0.37%), and Immigrants from Cuba ($76,701, a difference of 0.45%).
| Demographics | Rating | Rank | Householder Income Ages 25 - 44 years |
| Hondurans | 0.0 /100 | #319 | Tragic $78,540 |
| Choctaw | 0.0 /100 | #320 | Tragic $78,168 |
| Immigrants | Zaire | 0.0 /100 | #321 | Tragic $78,045 |
| Chickasaw | 0.0 /100 | #322 | Tragic $77,929 |
| Immigrants | Honduras | 0.0 /100 | #323 | Tragic $77,328 |
| Dutch West Indians | 0.0 /100 | #324 | Tragic $77,260 |
| Sioux | 0.0 /100 | #325 | Tragic $77,089 |
| Houma | 0.0 /100 | #326 | Tragic $77,044 |
| Immigrants | Bahamas | 0.0 /100 | #327 | Tragic $76,910 |
| Immigrants | Cuba | 0.0 /100 | #328 | Tragic $76,701 |
| Seminole | 0.0 /100 | #329 | Tragic $76,584 |
| Yakama | 0.0 /100 | #330 | Tragic $76,226 |
| Natives/Alaskans | 0.0 /100 | #331 | Tragic $75,647 |
| Bahamians | 0.0 /100 | #332 | Tragic $75,395 |
| Hopi | 0.0 /100 | #333 | Tragic $75,002 |