Native/Alaskan vs Houma Householder Income Ages 25 - 44 years
COMPARE
Native/Alaskan
Houma
Householder Income Ages 25 - 44 years
Householder Income Ages 25 - 44 years Comparison
Natives/Alaskans
Houma
$75,647
HOUSEHOLDER INCOME AGES 25 - 44 YEARS
0.0/ 100
METRIC RATING
331st/ 347
METRIC RANK
$77,044
HOUSEHOLDER INCOME AGES 25 - 44 YEARS
0.0/ 100
METRIC RATING
326th/ 347
METRIC RANK
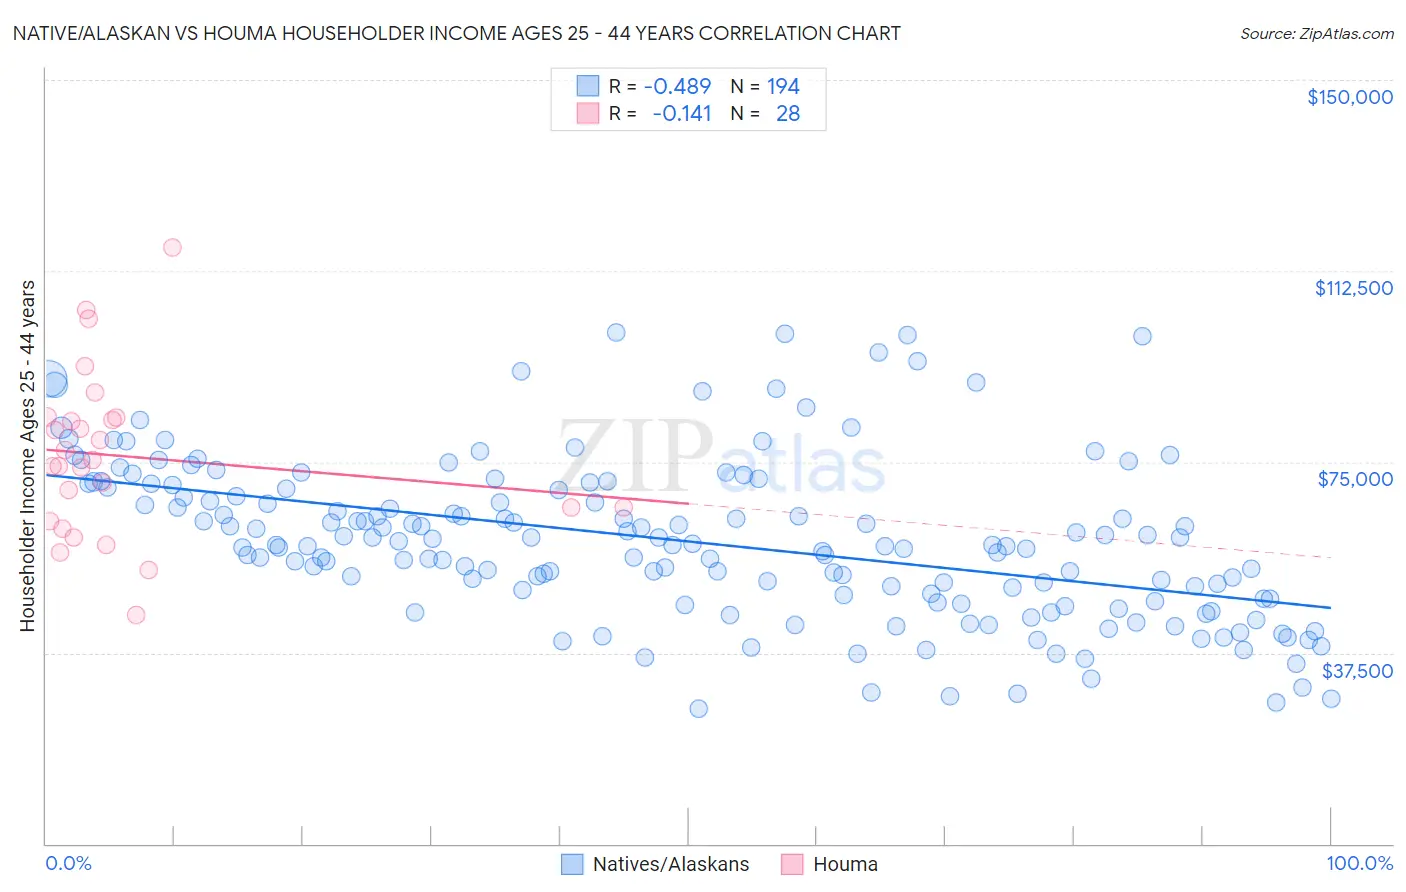
Native/Alaskan vs Houma Householder Income Ages 25 - 44 years Correlation Chart
The statistical analysis conducted on geographies consisting of 509,973,002 people shows a moderate negative correlation between the proportion of Natives/Alaskans and household income with householder between the ages 25 and 44 in the United States with a correlation coefficient (R) of -0.489 and weighted average of $75,647. Similarly, the statistical analysis conducted on geographies consisting of 36,744,797 people shows a poor negative correlation between the proportion of Houma and household income with householder between the ages 25 and 44 in the United States with a correlation coefficient (R) of -0.141 and weighted average of $77,044, a difference of 1.8%.
Householder Income Ages 25 - 44 years Correlation Summary
| Measurement | Native/Alaskan | Houma |
| Minimum | $26,585 | $44,839 |
| Maximum | $100,355 | $117,083 |
| Range | $73,770 | $72,244 |
| Mean | $59,417 | $76,117 |
| Median | $58,652 | $74,711 |
| Interquartile 25% (IQ1) | $48,151 | $64,767 |
| Interquartile 75% (IQ3) | $69,627 | $83,511 |
| Interquartile Range (IQR) | $21,476 | $18,745 |
| Standard Deviation (Sample) | $15,647 | $16,133 |
| Standard Deviation (Population) | $15,607 | $15,843 |
Demographics Similar to Natives/Alaskans and Houma by Householder Income Ages 25 - 44 years
In terms of householder income ages 25 - 44 years, the demographic groups most similar to Natives/Alaskans are Bahamian ($75,395, a difference of 0.34%), Yakama ($76,226, a difference of 0.76%), Hopi ($75,002, a difference of 0.86%), Creek ($74,847, a difference of 1.1%), and Kiowa ($74,776, a difference of 1.2%). Similarly, the demographic groups most similar to Houma are Sioux ($77,089, a difference of 0.060%), Immigrants from Bahamas ($76,910, a difference of 0.17%), Dutch West Indian ($77,260, a difference of 0.28%), Immigrants from Honduras ($77,328, a difference of 0.37%), and Immigrants from Cuba ($76,701, a difference of 0.45%).
| Demographics | Rating | Rank | Householder Income Ages 25 - 44 years |
| Immigrants | Mexico | 0.0 /100 | #318 | Tragic $78,809 |
| Hondurans | 0.0 /100 | #319 | Tragic $78,540 |
| Choctaw | 0.0 /100 | #320 | Tragic $78,168 |
| Immigrants | Zaire | 0.0 /100 | #321 | Tragic $78,045 |
| Chickasaw | 0.0 /100 | #322 | Tragic $77,929 |
| Immigrants | Honduras | 0.0 /100 | #323 | Tragic $77,328 |
| Dutch West Indians | 0.0 /100 | #324 | Tragic $77,260 |
| Sioux | 0.0 /100 | #325 | Tragic $77,089 |
| Houma | 0.0 /100 | #326 | Tragic $77,044 |
| Immigrants | Bahamas | 0.0 /100 | #327 | Tragic $76,910 |
| Immigrants | Cuba | 0.0 /100 | #328 | Tragic $76,701 |
| Seminole | 0.0 /100 | #329 | Tragic $76,584 |
| Yakama | 0.0 /100 | #330 | Tragic $76,226 |
| Natives/Alaskans | 0.0 /100 | #331 | Tragic $75,647 |
| Bahamians | 0.0 /100 | #332 | Tragic $75,395 |
| Hopi | 0.0 /100 | #333 | Tragic $75,002 |
| Creek | 0.0 /100 | #334 | Tragic $74,847 |
| Kiowa | 0.0 /100 | #335 | Tragic $74,776 |
| Yup'ik | 0.0 /100 | #336 | Tragic $73,688 |
| Blacks/African Americans | 0.0 /100 | #337 | Tragic $73,370 |
| Immigrants | Yemen | 0.0 /100 | #338 | Tragic $73,043 |