Greek vs Creek Median Earnings
COMPARE
Greek
Creek
Median Earnings
Median Earnings Comparison
Greeks
Creek
$51,164
MEDIAN EARNINGS
99.9/ 100
METRIC RATING
65th/ 347
METRIC RANK
$39,648
MEDIAN EARNINGS
0.0/ 100
METRIC RATING
325th/ 347
METRIC RANK
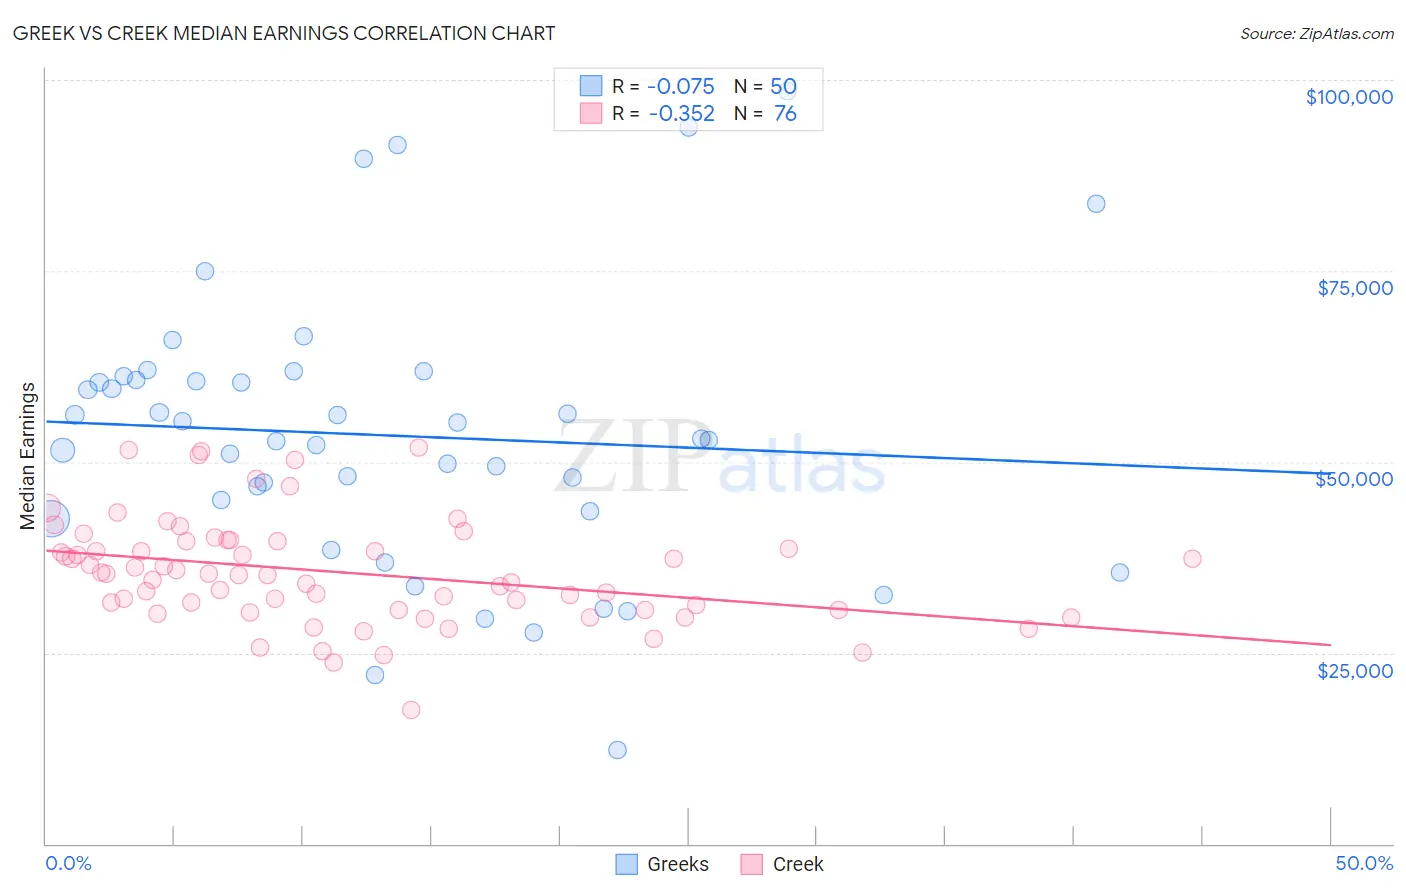
Greek vs Creek Median Earnings Correlation Chart
The statistical analysis conducted on geographies consisting of 482,719,843 people shows a slight negative correlation between the proportion of Greeks and median earnings in the United States with a correlation coefficient (R) of -0.075 and weighted average of $51,164. Similarly, the statistical analysis conducted on geographies consisting of 178,470,234 people shows a mild negative correlation between the proportion of Creek and median earnings in the United States with a correlation coefficient (R) of -0.352 and weighted average of $39,648, a difference of 29.0%.
Median Earnings Correlation Summary
| Measurement | Greek | Creek |
| Minimum | $12,321 | $17,500 |
| Maximum | $98,462 | $51,875 |
| Range | $86,141 | $34,375 |
| Mean | $53,439 | $35,536 |
| Median | $52,981 | $35,262 |
| Interquartile 25% (IQ1) | $43,544 | $30,664 |
| Interquartile 75% (IQ3) | $60,703 | $39,531 |
| Interquartile Range (IQR) | $17,159 | $8,868 |
| Standard Deviation (Sample) | $17,942 | $6,944 |
| Standard Deviation (Population) | $17,762 | $6,899 |
Similar Demographics by Median Earnings
Demographics Similar to Greeks by Median Earnings
In terms of median earnings, the demographic groups most similar to Greeks are Afghan ($51,112, a difference of 0.10%), Immigrants from Spain ($51,092, a difference of 0.14%), New Zealander ($51,246, a difference of 0.16%), Paraguayan ($51,068, a difference of 0.19%), and Mongolian ($51,038, a difference of 0.25%).
| Demographics | Rating | Rank | Median Earnings |
| Immigrants | Bolivia | 99.9 /100 | #58 | Exceptional $51,605 |
| Immigrants | Croatia | 99.9 /100 | #59 | Exceptional $51,581 |
| Immigrants | Serbia | 99.9 /100 | #60 | Exceptional $51,557 |
| Immigrants | Latvia | 99.9 /100 | #61 | Exceptional $51,555 |
| Immigrants | Romania | 99.9 /100 | #62 | Exceptional $51,337 |
| Immigrants | Bulgaria | 99.9 /100 | #63 | Exceptional $51,318 |
| New Zealanders | 99.9 /100 | #64 | Exceptional $51,246 |
| Greeks | 99.9 /100 | #65 | Exceptional $51,164 |
| Afghans | 99.9 /100 | #66 | Exceptional $51,112 |
| Immigrants | Spain | 99.9 /100 | #67 | Exceptional $51,092 |
| Paraguayans | 99.9 /100 | #68 | Exceptional $51,068 |
| Mongolians | 99.8 /100 | #69 | Exceptional $51,038 |
| Lithuanians | 99.8 /100 | #70 | Exceptional $50,991 |
| Immigrants | Ukraine | 99.8 /100 | #71 | Exceptional $50,984 |
| Immigrants | Egypt | 99.8 /100 | #72 | Exceptional $50,901 |
Demographics Similar to Creek by Median Earnings
In terms of median earnings, the demographic groups most similar to Creek are Ottawa ($39,721, a difference of 0.18%), Bahamian ($39,735, a difference of 0.22%), Immigrants from Yemen ($39,540, a difference of 0.27%), Immigrants from Central America ($39,762, a difference of 0.29%), and Yuman ($39,523, a difference of 0.32%).
| Demographics | Rating | Rank | Median Earnings |
| Dutch West Indians | 0.0 /100 | #318 | Tragic $40,107 |
| Blacks/African Americans | 0.0 /100 | #319 | Tragic $40,085 |
| Immigrants | Bahamas | 0.0 /100 | #320 | Tragic $39,861 |
| Mexicans | 0.0 /100 | #321 | Tragic $39,834 |
| Immigrants | Central America | 0.0 /100 | #322 | Tragic $39,762 |
| Bahamians | 0.0 /100 | #323 | Tragic $39,735 |
| Ottawa | 0.0 /100 | #324 | Tragic $39,721 |
| Creek | 0.0 /100 | #325 | Tragic $39,648 |
| Immigrants | Yemen | 0.0 /100 | #326 | Tragic $39,540 |
| Yuman | 0.0 /100 | #327 | Tragic $39,523 |
| Sioux | 0.0 /100 | #328 | Tragic $39,448 |
| Kiowa | 0.0 /100 | #329 | Tragic $39,232 |
| Immigrants | Congo | 0.0 /100 | #330 | Tragic $39,169 |
| Immigrants | Mexico | 0.0 /100 | #331 | Tragic $39,114 |
| Yakama | 0.0 /100 | #332 | Tragic $39,107 |