Immigrants from Poland vs Polish Median Earnings
COMPARE
Immigrants from Poland
Polish
Median Earnings
Median Earnings Comparison
Immigrants from Poland
Poles
$49,633
MEDIAN EARNINGS
98.9/ 100
METRIC RATING
100th/ 347
METRIC RANK
$48,659
MEDIAN EARNINGS
95.8/ 100
METRIC RATING
119th/ 347
METRIC RANK
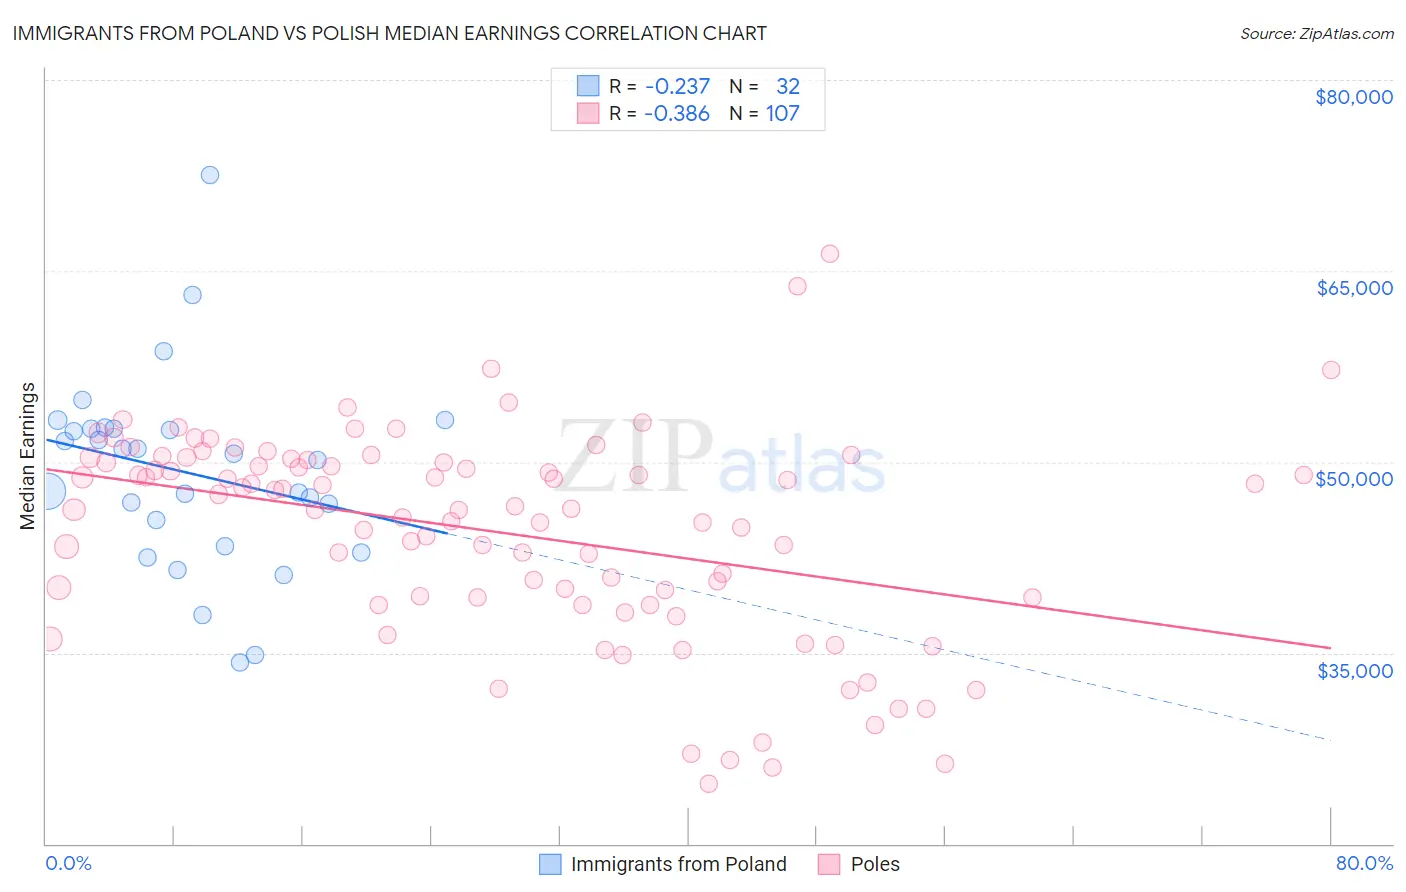
Immigrants from Poland vs Polish Median Earnings Correlation Chart
The statistical analysis conducted on geographies consisting of 304,849,071 people shows a weak negative correlation between the proportion of Immigrants from Poland and median earnings in the United States with a correlation coefficient (R) of -0.237 and weighted average of $49,633. Similarly, the statistical analysis conducted on geographies consisting of 560,312,185 people shows a mild negative correlation between the proportion of Poles and median earnings in the United States with a correlation coefficient (R) of -0.386 and weighted average of $48,659, a difference of 2.0%.
Median Earnings Correlation Summary
| Measurement | Immigrants from Poland | Polish |
| Minimum | $34,220 | $24,750 |
| Maximum | $72,500 | $66,354 |
| Range | $38,280 | $41,604 |
| Mean | $49,130 | $44,491 |
| Median | $50,398 | $46,283 |
| Interquartile 25% (IQ1) | $44,359 | $39,299 |
| Interquartile 75% (IQ3) | $52,592 | $50,191 |
| Interquartile Range (IQR) | $8,233 | $10,892 |
| Standard Deviation (Sample) | $7,639 | $8,192 |
| Standard Deviation (Population) | $7,518 | $8,153 |
Demographics Similar to Immigrants from Poland and Poles by Median Earnings
In terms of median earnings, the demographic groups most similar to Immigrants from Poland are Jordanian ($49,632, a difference of 0.0%), Immigrants from Afghanistan ($49,645, a difference of 0.020%), Ethiopian ($49,572, a difference of 0.12%), Austrian ($49,501, a difference of 0.27%), and Immigrants from Brazil ($49,463, a difference of 0.34%). Similarly, the demographic groups most similar to Poles are Immigrants from Jordan ($48,673, a difference of 0.030%), Serbian ($48,677, a difference of 0.040%), Korean ($48,727, a difference of 0.14%), Chinese ($48,836, a difference of 0.36%), and Moroccan ($48,838, a difference of 0.37%).
| Demographics | Rating | Rank | Median Earnings |
| Immigrants | Afghanistan | 98.9 /100 | #99 | Exceptional $49,645 |
| Immigrants | Poland | 98.9 /100 | #100 | Exceptional $49,633 |
| Jordanians | 98.9 /100 | #101 | Exceptional $49,632 |
| Ethiopians | 98.8 /100 | #102 | Exceptional $49,572 |
| Austrians | 98.7 /100 | #103 | Exceptional $49,501 |
| Immigrants | Brazil | 98.6 /100 | #104 | Exceptional $49,463 |
| Immigrants | Western Asia | 98.4 /100 | #105 | Exceptional $49,389 |
| Immigrants | Albania | 98.4 /100 | #106 | Exceptional $49,377 |
| Immigrants | Morocco | 98.4 /100 | #107 | Exceptional $49,368 |
| Palestinians | 98.0 /100 | #108 | Exceptional $49,209 |
| Syrians | 97.1 /100 | #109 | Exceptional $48,934 |
| Immigrants | Ethiopia | 97.1 /100 | #110 | Exceptional $48,924 |
| Immigrants | Zimbabwe | 97.0 /100 | #111 | Exceptional $48,913 |
| Northern Europeans | 96.9 /100 | #112 | Exceptional $48,887 |
| Immigrants | Kuwait | 96.8 /100 | #113 | Exceptional $48,861 |
| Moroccans | 96.7 /100 | #114 | Exceptional $48,838 |
| Chinese | 96.7 /100 | #115 | Exceptional $48,836 |
| Koreans | 96.2 /100 | #116 | Exceptional $48,727 |
| Serbians | 95.9 /100 | #117 | Exceptional $48,677 |
| Immigrants | Jordan | 95.9 /100 | #118 | Exceptional $48,673 |
| Poles | 95.8 /100 | #119 | Exceptional $48,659 |