Immigrants from Poland vs Assyrian/Chaldean/Syriac Median Earnings
COMPARE
Immigrants from Poland
Assyrian/Chaldean/Syriac
Median Earnings
Median Earnings Comparison
Immigrants from Poland
Assyrians/Chaldeans/Syriacs
$49,633
MEDIAN EARNINGS
98.9/ 100
METRIC RATING
100th/ 347
METRIC RANK
$48,304
MEDIAN EARNINGS
93.3/ 100
METRIC RATING
126th/ 347
METRIC RANK
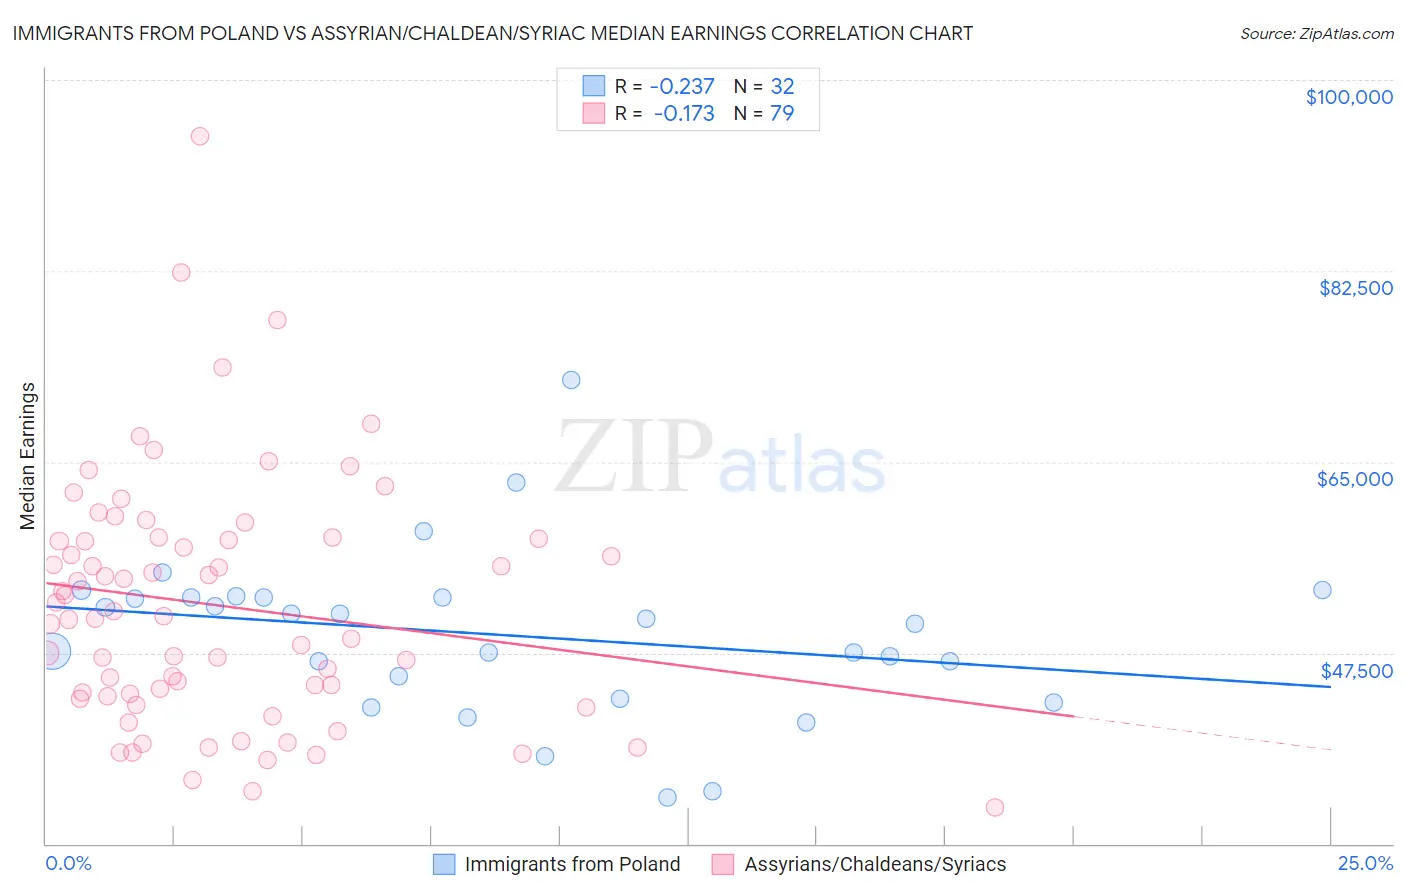
Immigrants from Poland vs Assyrian/Chaldean/Syriac Median Earnings Correlation Chart
The statistical analysis conducted on geographies consisting of 304,849,071 people shows a weak negative correlation between the proportion of Immigrants from Poland and median earnings in the United States with a correlation coefficient (R) of -0.237 and weighted average of $49,633. Similarly, the statistical analysis conducted on geographies consisting of 110,275,669 people shows a poor negative correlation between the proportion of Assyrians/Chaldeans/Syriacs and median earnings in the United States with a correlation coefficient (R) of -0.173 and weighted average of $48,304, a difference of 2.8%.
Median Earnings Correlation Summary
| Measurement | Immigrants from Poland | Assyrian/Chaldean/Syriac |
| Minimum | $34,220 | $33,351 |
| Maximum | $72,500 | $94,792 |
| Range | $38,280 | $61,441 |
| Mean | $49,130 | $51,833 |
| Median | $50,398 | $50,898 |
| Interquartile 25% (IQ1) | $44,359 | $43,507 |
| Interquartile 75% (IQ3) | $52,592 | $57,898 |
| Interquartile Range (IQR) | $8,233 | $14,391 |
| Standard Deviation (Sample) | $7,639 | $11,326 |
| Standard Deviation (Population) | $7,518 | $11,254 |
Similar Demographics by Median Earnings
Demographics Similar to Immigrants from Poland by Median Earnings
In terms of median earnings, the demographic groups most similar to Immigrants from Poland are Jordanian ($49,632, a difference of 0.0%), Immigrants from Afghanistan ($49,645, a difference of 0.020%), Immigrants from Northern Africa ($49,648, a difference of 0.030%), Immigrants from North Macedonia ($49,658, a difference of 0.050%), and Immigrants from Lebanon ($49,682, a difference of 0.10%).
| Demographics | Rating | Rank | Median Earnings |
| Armenians | 99.1 /100 | #93 | Exceptional $49,804 |
| Croatians | 99.0 /100 | #94 | Exceptional $49,724 |
| Immigrants | England | 99.0 /100 | #95 | Exceptional $49,722 |
| Immigrants | Lebanon | 99.0 /100 | #96 | Exceptional $49,682 |
| Immigrants | North Macedonia | 98.9 /100 | #97 | Exceptional $49,658 |
| Immigrants | Northern Africa | 98.9 /100 | #98 | Exceptional $49,648 |
| Immigrants | Afghanistan | 98.9 /100 | #99 | Exceptional $49,645 |
| Immigrants | Poland | 98.9 /100 | #100 | Exceptional $49,633 |
| Jordanians | 98.9 /100 | #101 | Exceptional $49,632 |
| Ethiopians | 98.8 /100 | #102 | Exceptional $49,572 |
| Austrians | 98.7 /100 | #103 | Exceptional $49,501 |
| Immigrants | Brazil | 98.6 /100 | #104 | Exceptional $49,463 |
| Immigrants | Western Asia | 98.4 /100 | #105 | Exceptional $49,389 |
| Immigrants | Albania | 98.4 /100 | #106 | Exceptional $49,377 |
| Immigrants | Morocco | 98.4 /100 | #107 | Exceptional $49,368 |
Demographics Similar to Assyrians/Chaldeans/Syriacs by Median Earnings
In terms of median earnings, the demographic groups most similar to Assyrians/Chaldeans/Syriacs are Immigrants from Fiji ($48,305, a difference of 0.0%), Sierra Leonean ($48,286, a difference of 0.040%), Immigrants from Philippines ($48,266, a difference of 0.080%), Pakistani ($48,254, a difference of 0.10%), and Brazilian ($48,356, a difference of 0.11%).
| Demographics | Rating | Rank | Median Earnings |
| Poles | 95.8 /100 | #119 | Exceptional $48,659 |
| Carpatho Rusyns | 95.5 /100 | #120 | Exceptional $48,617 |
| Arabs | 95.4 /100 | #121 | Exceptional $48,599 |
| Chileans | 94.8 /100 | #122 | Exceptional $48,504 |
| Immigrants | Syria | 93.9 /100 | #123 | Exceptional $48,375 |
| Brazilians | 93.7 /100 | #124 | Exceptional $48,356 |
| Immigrants | Fiji | 93.3 /100 | #125 | Exceptional $48,305 |
| Assyrians/Chaldeans/Syriacs | 93.3 /100 | #126 | Exceptional $48,304 |
| Sierra Leoneans | 93.1 /100 | #127 | Exceptional $48,286 |
| Immigrants | Philippines | 92.9 /100 | #128 | Exceptional $48,266 |
| Pakistanis | 92.8 /100 | #129 | Exceptional $48,254 |
| Zimbabweans | 92.6 /100 | #130 | Exceptional $48,229 |
| Lebanese | 92.5 /100 | #131 | Exceptional $48,226 |
| British | 92.2 /100 | #132 | Exceptional $48,189 |
| Immigrants | Uganda | 90.5 /100 | #133 | Exceptional $48,041 |