Immigrants from Venezuela vs Scotch-Irish Per Capita Income
COMPARE
Immigrants from Venezuela
Scotch-Irish
Per Capita Income
Per Capita Income Comparison
Immigrants from Venezuela
Scotch-Irish
$41,727
PER CAPITA INCOME
10.2/ 100
METRIC RATING
213th/ 347
METRIC RANK
$42,563
PER CAPITA INCOME
22.6/ 100
METRIC RATING
197th/ 347
METRIC RANK
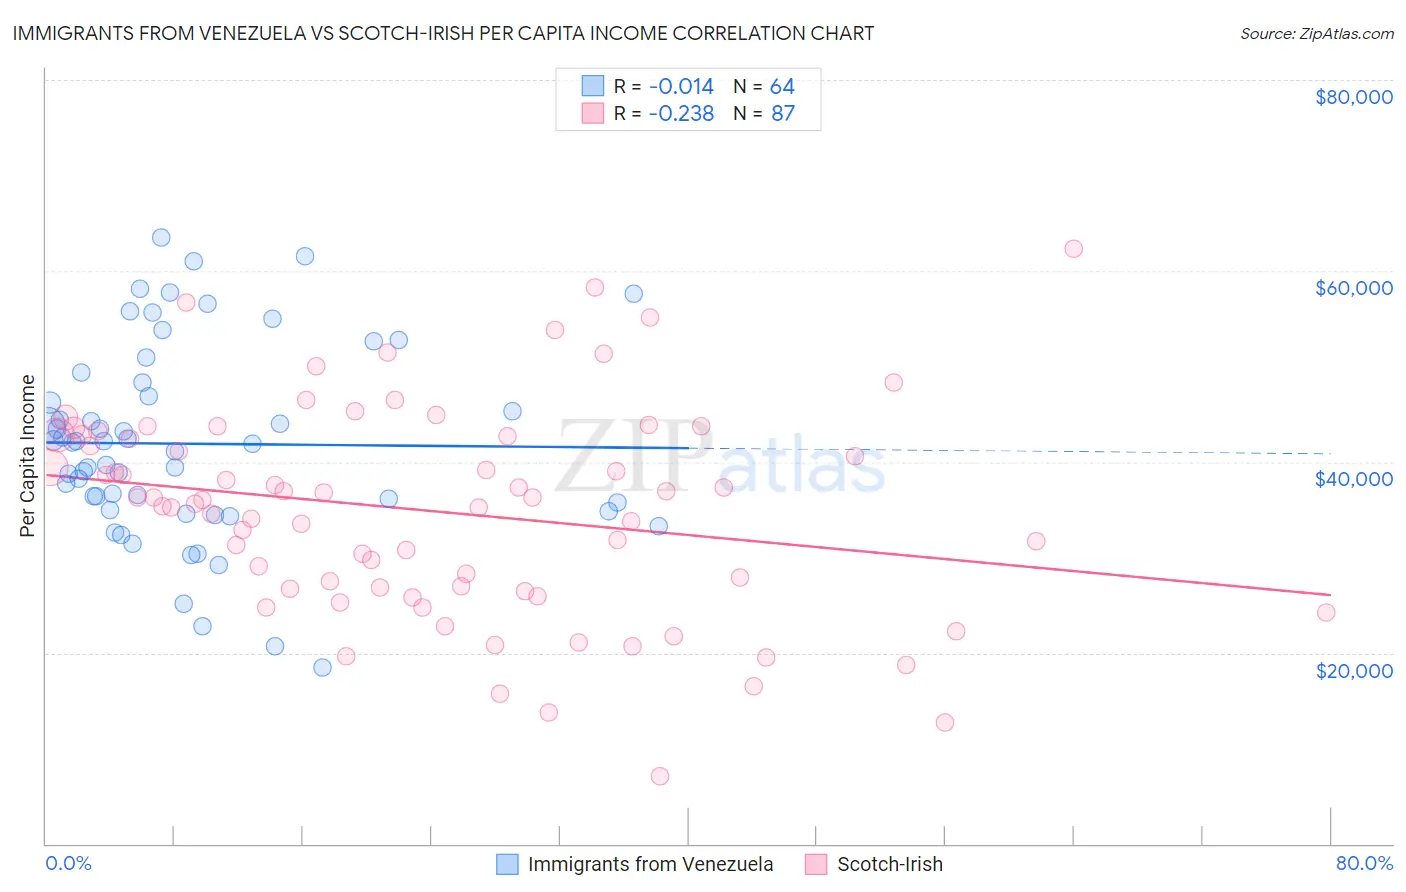
Immigrants from Venezuela vs Scotch-Irish Per Capita Income Correlation Chart
The statistical analysis conducted on geographies consisting of 287,848,526 people shows no correlation between the proportion of Immigrants from Venezuela and per capita income in the United States with a correlation coefficient (R) of -0.014 and weighted average of $41,727. Similarly, the statistical analysis conducted on geographies consisting of 548,816,006 people shows a weak negative correlation between the proportion of Scotch-Irish and per capita income in the United States with a correlation coefficient (R) of -0.238 and weighted average of $42,563, a difference of 2.0%.
Per Capita Income Correlation Summary
| Measurement | Immigrants from Venezuela | Scotch-Irish |
| Minimum | $18,497 | $7,124 |
| Maximum | $63,503 | $62,377 |
| Range | $45,006 | $55,253 |
| Mean | $41,894 | $34,830 |
| Median | $41,937 | $35,981 |
| Interquartile 25% (IQ1) | $35,384 | $26,689 |
| Interquartile 75% (IQ3) | $47,592 | $42,802 |
| Interquartile Range (IQR) | $12,208 | $16,113 |
| Standard Deviation (Sample) | $10,042 | $10,987 |
| Standard Deviation (Population) | $9,963 | $10,923 |
Demographics Similar to Immigrants from Venezuela and Scotch-Irish by Per Capita Income
In terms of per capita income, the demographic groups most similar to Immigrants from Venezuela are Immigrants from Bangladesh ($41,709, a difference of 0.040%), Sudanese ($41,695, a difference of 0.080%), Immigrants from Senegal ($41,830, a difference of 0.25%), Immigrants from Panama ($41,853, a difference of 0.30%), and Ecuadorian ($41,958, a difference of 0.55%). Similarly, the demographic groups most similar to Scotch-Irish are Dutch ($42,605, a difference of 0.10%), Immigrants from Kenya ($42,661, a difference of 0.23%), Immigrants from Portugal ($42,412, a difference of 0.36%), Barbadian ($42,406, a difference of 0.37%), and Vietnamese ($42,368, a difference of 0.46%).
| Demographics | Rating | Rank | Per Capita Income |
| Immigrants | Kenya | 24.5 /100 | #195 | Fair $42,661 |
| Dutch | 23.4 /100 | #196 | Fair $42,605 |
| Scotch-Irish | 22.6 /100 | #197 | Fair $42,563 |
| Immigrants | Portugal | 19.7 /100 | #198 | Poor $42,412 |
| Barbadians | 19.6 /100 | #199 | Poor $42,406 |
| Vietnamese | 19.0 /100 | #200 | Poor $42,368 |
| Immigrants | Thailand | 17.6 /100 | #201 | Poor $42,289 |
| Immigrants | Bosnia and Herzegovina | 17.5 /100 | #202 | Poor $42,278 |
| Spanish | 17.0 /100 | #203 | Poor $42,249 |
| Aleuts | 16.4 /100 | #204 | Poor $42,210 |
| Whites/Caucasians | 15.9 /100 | #205 | Poor $42,180 |
| Ghanaians | 15.7 /100 | #206 | Poor $42,164 |
| Venezuelans | 14.4 /100 | #207 | Poor $42,074 |
| Panamanians | 13.9 /100 | #208 | Poor $42,035 |
| Immigrants | Sudan | 13.2 /100 | #209 | Poor $41,986 |
| Ecuadorians | 12.9 /100 | #210 | Poor $41,958 |
| Immigrants | Panama | 11.6 /100 | #211 | Poor $41,853 |
| Immigrants | Senegal | 11.3 /100 | #212 | Poor $41,830 |
| Immigrants | Venezuela | 10.2 /100 | #213 | Poor $41,727 |
| Immigrants | Bangladesh | 10.1 /100 | #214 | Poor $41,709 |
| Sudanese | 9.9 /100 | #215 | Tragic $41,695 |