Immigrants from Oceania vs Immigrants from Norway Unemployment Among Seniors over 75 years
COMPARE
Immigrants from Oceania
Immigrants from Norway
Unemployment Among Seniors over 75 years
Unemployment Among Seniors over 75 years Comparison
Immigrants from Oceania
Immigrants from Norway
9.0%
UNEMPLOYMENT AMONG SENIORS OVER 75 YEARS
11.8/ 100
METRIC RATING
216th/ 347
METRIC RANK
7.7%
UNEMPLOYMENT AMONG SENIORS OVER 75 YEARS
100.0/ 100
METRIC RATING
35th/ 347
METRIC RANK
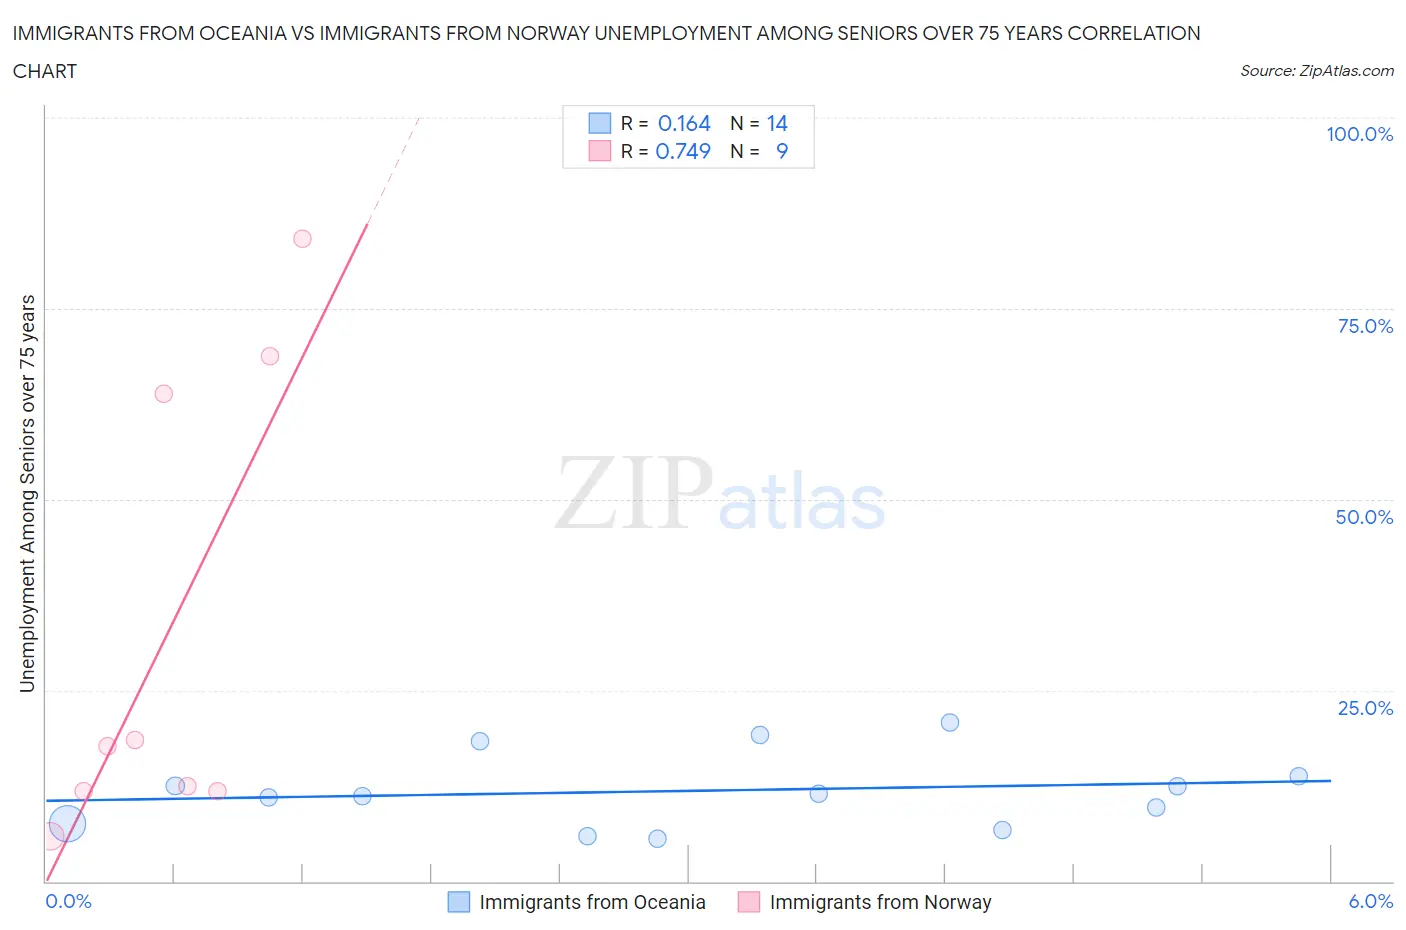
Immigrants from Oceania vs Immigrants from Norway Unemployment Among Seniors over 75 years Correlation Chart
The statistical analysis conducted on geographies consisting of 172,821,637 people shows a poor positive correlation between the proportion of Immigrants from Oceania and unemployment rate among seniors over the age of 75 in the United States with a correlation coefficient (R) of 0.164 and weighted average of 9.0%. Similarly, the statistical analysis conducted on geographies consisting of 86,216,399 people shows a strong positive correlation between the proportion of Immigrants from Norway and unemployment rate among seniors over the age of 75 in the United States with a correlation coefficient (R) of 0.749 and weighted average of 7.7%, a difference of 16.9%.
Unemployment Among Seniors over 75 years Correlation Summary
| Measurement | Immigrants from Oceania | Immigrants from Norway |
| Minimum | 5.5% | 5.9% |
| Maximum | 20.8% | 84.2% |
| Range | 15.2% | 78.3% |
| Mean | 11.8% | 32.8% |
| Median | 11.3% | 17.7% |
| Interquartile 25% (IQ1) | 7.6% | 11.8% |
| Interquartile 75% (IQ3) | 13.8% | 66.3% |
| Interquartile Range (IQR) | 6.2% | 54.6% |
| Standard Deviation (Sample) | 4.8% | 30.3% |
| Standard Deviation (Population) | 4.7% | 28.6% |
Similar Demographics by Unemployment Among Seniors over 75 years
Demographics Similar to Immigrants from Oceania by Unemployment Among Seniors over 75 years
In terms of unemployment among seniors over 75 years, the demographic groups most similar to Immigrants from Oceania are Immigrants from Western Asia (9.0%, a difference of 0.080%), Lebanese (9.0%, a difference of 0.10%), Immigrants from Brazil (9.0%, a difference of 0.18%), Immigrants from Latin America (9.0%, a difference of 0.19%), and Romanian (9.0%, a difference of 0.23%).
| Demographics | Rating | Rank | Unemployment Among Seniors over 75 years |
| Salvadorans | 15.4 /100 | #209 | Poor 8.9% |
| Bermudans | 15.0 /100 | #210 | Poor 8.9% |
| Delaware | 14.6 /100 | #211 | Poor 9.0% |
| Romanians | 13.8 /100 | #212 | Poor 9.0% |
| Immigrants | Latin America | 13.4 /100 | #213 | Poor 9.0% |
| Immigrants | Brazil | 13.3 /100 | #214 | Poor 9.0% |
| Immigrants | Western Asia | 12.5 /100 | #215 | Poor 9.0% |
| Immigrants | Oceania | 11.8 /100 | #216 | Poor 9.0% |
| Lebanese | 11.1 /100 | #217 | Poor 9.0% |
| Immigrants | Africa | 9.7 /100 | #218 | Tragic 9.0% |
| Afghans | 8.3 /100 | #219 | Tragic 9.0% |
| Immigrants | Zimbabwe | 7.8 /100 | #220 | Tragic 9.0% |
| Guamanians/Chamorros | 7.7 /100 | #221 | Tragic 9.0% |
| Peruvians | 7.3 /100 | #222 | Tragic 9.0% |
| Immigrants | Jordan | 6.9 /100 | #223 | Tragic 9.0% |
Demographics Similar to Immigrants from Norway by Unemployment Among Seniors over 75 years
In terms of unemployment among seniors over 75 years, the demographic groups most similar to Immigrants from Norway are Luxembourger (7.7%, a difference of 0.10%), Immigrants from Eritrea (7.7%, a difference of 0.21%), Immigrants from Hungary (7.7%, a difference of 0.30%), Kiowa (7.7%, a difference of 0.32%), and Ugandan (7.7%, a difference of 0.35%).
| Demographics | Rating | Rank | Unemployment Among Seniors over 75 years |
| Immigrants | Israel | 100.0 /100 | #28 | Exceptional 7.6% |
| Immigrants | Iran | 100.0 /100 | #29 | Exceptional 7.6% |
| Immigrants | Sweden | 100.0 /100 | #30 | Exceptional 7.6% |
| Guyanese | 100.0 /100 | #31 | Exceptional 7.6% |
| Immigrants | Hong Kong | 100.0 /100 | #32 | Exceptional 7.6% |
| Cambodians | 100.0 /100 | #33 | Exceptional 7.6% |
| Immigrants | Eritrea | 100.0 /100 | #34 | Exceptional 7.7% |
| Immigrants | Norway | 100.0 /100 | #35 | Exceptional 7.7% |
| Luxembourgers | 100.0 /100 | #36 | Exceptional 7.7% |
| Immigrants | Hungary | 100.0 /100 | #37 | Exceptional 7.7% |
| Kiowa | 100.0 /100 | #38 | Exceptional 7.7% |
| Ugandans | 100.0 /100 | #39 | Exceptional 7.7% |
| Colville | 100.0 /100 | #40 | Exceptional 7.7% |
| Immigrants | Burma/Myanmar | 100.0 /100 | #41 | Exceptional 7.7% |
| Pueblo | 100.0 /100 | #42 | Exceptional 7.7% |