Immigrants from Oceania vs Menominee Householder Income Ages 45 - 64 years
COMPARE
Immigrants from Oceania
Menominee
Householder Income Ages 45 - 64 years
Householder Income Ages 45 - 64 years Comparison
Immigrants from Oceania
Menominee
$103,705
HOUSEHOLDER INCOME AGES 45 - 64 YEARS
84.5/ 100
METRIC RATING
139th/ 347
METRIC RANK
$76,903
HOUSEHOLDER INCOME AGES 45 - 64 YEARS
0.0/ 100
METRIC RATING
334th/ 347
METRIC RANK
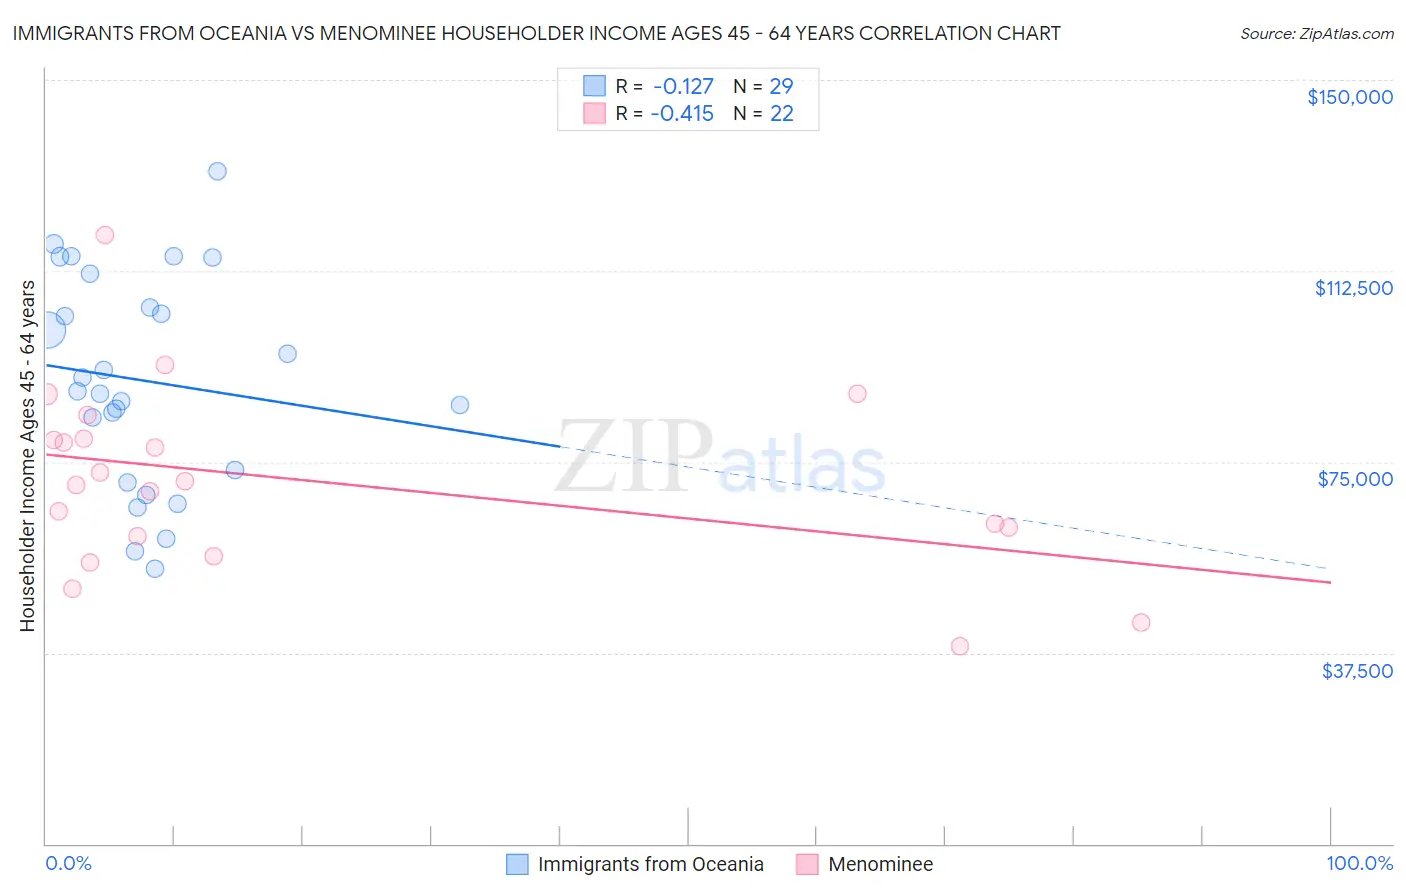
Immigrants from Oceania vs Menominee Householder Income Ages 45 - 64 years Correlation Chart
The statistical analysis conducted on geographies consisting of 305,099,752 people shows a poor negative correlation between the proportion of Immigrants from Oceania and household income with householder between the ages 45 and 64 in the United States with a correlation coefficient (R) of -0.127 and weighted average of $103,705. Similarly, the statistical analysis conducted on geographies consisting of 45,774,690 people shows a moderate negative correlation between the proportion of Menominee and household income with householder between the ages 45 and 64 in the United States with a correlation coefficient (R) of -0.415 and weighted average of $76,903, a difference of 34.8%.
Householder Income Ages 45 - 64 years Correlation Summary
| Measurement | Immigrants from Oceania | Menominee |
| Minimum | $53,935 | $38,750 |
| Maximum | $132,083 | $119,583 |
| Range | $78,148 | $80,833 |
| Mean | $90,991 | $71,291 |
| Median | $88,770 | $70,827 |
| Interquartile 25% (IQ1) | $72,125 | $60,417 |
| Interquartile 75% (IQ3) | $108,595 | $79,440 |
| Interquartile Range (IQR) | $36,470 | $19,023 |
| Standard Deviation (Sample) | $20,662 | $18,138 |
| Standard Deviation (Population) | $20,302 | $17,721 |
Similar Demographics by Householder Income Ages 45 - 64 years
Demographics Similar to Immigrants from Oceania by Householder Income Ages 45 - 64 years
In terms of householder income ages 45 - 64 years, the demographic groups most similar to Immigrants from Oceania are Norwegian ($103,682, a difference of 0.020%), Ethiopian ($103,736, a difference of 0.030%), Immigrants from Uganda ($103,584, a difference of 0.12%), Luxembourger ($103,536, a difference of 0.16%), and Serbian ($103,522, a difference of 0.18%).
| Demographics | Rating | Rank | Householder Income Ages 45 - 64 years |
| Lebanese | 90.1 /100 | #132 | Exceptional $104,734 |
| Arabs | 89.3 /100 | #133 | Excellent $104,566 |
| Canadians | 89.3 /100 | #134 | Excellent $104,560 |
| Brazilians | 88.6 /100 | #135 | Excellent $104,408 |
| Taiwanese | 87.4 /100 | #136 | Excellent $104,180 |
| Hungarians | 85.8 /100 | #137 | Excellent $103,913 |
| Ethiopians | 84.7 /100 | #138 | Excellent $103,736 |
| Immigrants | Oceania | 84.5 /100 | #139 | Excellent $103,705 |
| Norwegians | 84.3 /100 | #140 | Excellent $103,682 |
| Immigrants | Uganda | 83.7 /100 | #141 | Excellent $103,584 |
| Luxembourgers | 83.3 /100 | #142 | Excellent $103,536 |
| Serbians | 83.2 /100 | #143 | Excellent $103,522 |
| Czechs | 83.1 /100 | #144 | Excellent $103,507 |
| Ugandans | 82.9 /100 | #145 | Excellent $103,472 |
| Immigrants | Chile | 82.5 /100 | #146 | Excellent $103,412 |
Demographics Similar to Menominee by Householder Income Ages 45 - 64 years
In terms of householder income ages 45 - 64 years, the demographic groups most similar to Menominee are Cheyenne ($76,362, a difference of 0.71%), Immigrants from Congo ($77,850, a difference of 1.2%), Arapaho ($75,945, a difference of 1.3%), Pueblo ($75,601, a difference of 1.7%), and Hopi ($75,562, a difference of 1.8%).
| Demographics | Rating | Rank | Householder Income Ages 45 - 64 years |
| Seminole | 0.0 /100 | #327 | Tragic $80,077 |
| Natives/Alaskans | 0.0 /100 | #328 | Tragic $79,816 |
| Dutch West Indians | 0.0 /100 | #329 | Tragic $79,171 |
| Creek | 0.0 /100 | #330 | Tragic $78,960 |
| Immigrants | Dominican Republic | 0.0 /100 | #331 | Tragic $78,836 |
| Blacks/African Americans | 0.0 /100 | #332 | Tragic $78,556 |
| Immigrants | Congo | 0.0 /100 | #333 | Tragic $77,850 |
| Menominee | 0.0 /100 | #334 | Tragic $76,903 |
| Cheyenne | 0.0 /100 | #335 | Tragic $76,362 |
| Arapaho | 0.0 /100 | #336 | Tragic $75,945 |
| Pueblo | 0.0 /100 | #337 | Tragic $75,601 |
| Hopi | 0.0 /100 | #338 | Tragic $75,562 |
| Kiowa | 0.0 /100 | #339 | Tragic $74,815 |
| Immigrants | Yemen | 0.0 /100 | #340 | Tragic $74,575 |
| Crow | 0.0 /100 | #341 | Tragic $74,257 |