Immigrants from Oceania vs Immigrants from Spain Householder Income Ages 45 - 64 years
COMPARE
Immigrants from Oceania
Immigrants from Spain
Householder Income Ages 45 - 64 years
Householder Income Ages 45 - 64 years Comparison
Immigrants from Oceania
Immigrants from Spain
$103,705
HOUSEHOLDER INCOME AGES 45 - 64 YEARS
84.5/ 100
METRIC RATING
139th/ 347
METRIC RANK
$109,051
HOUSEHOLDER INCOME AGES 45 - 64 YEARS
98.8/ 100
METRIC RATING
83rd/ 347
METRIC RANK
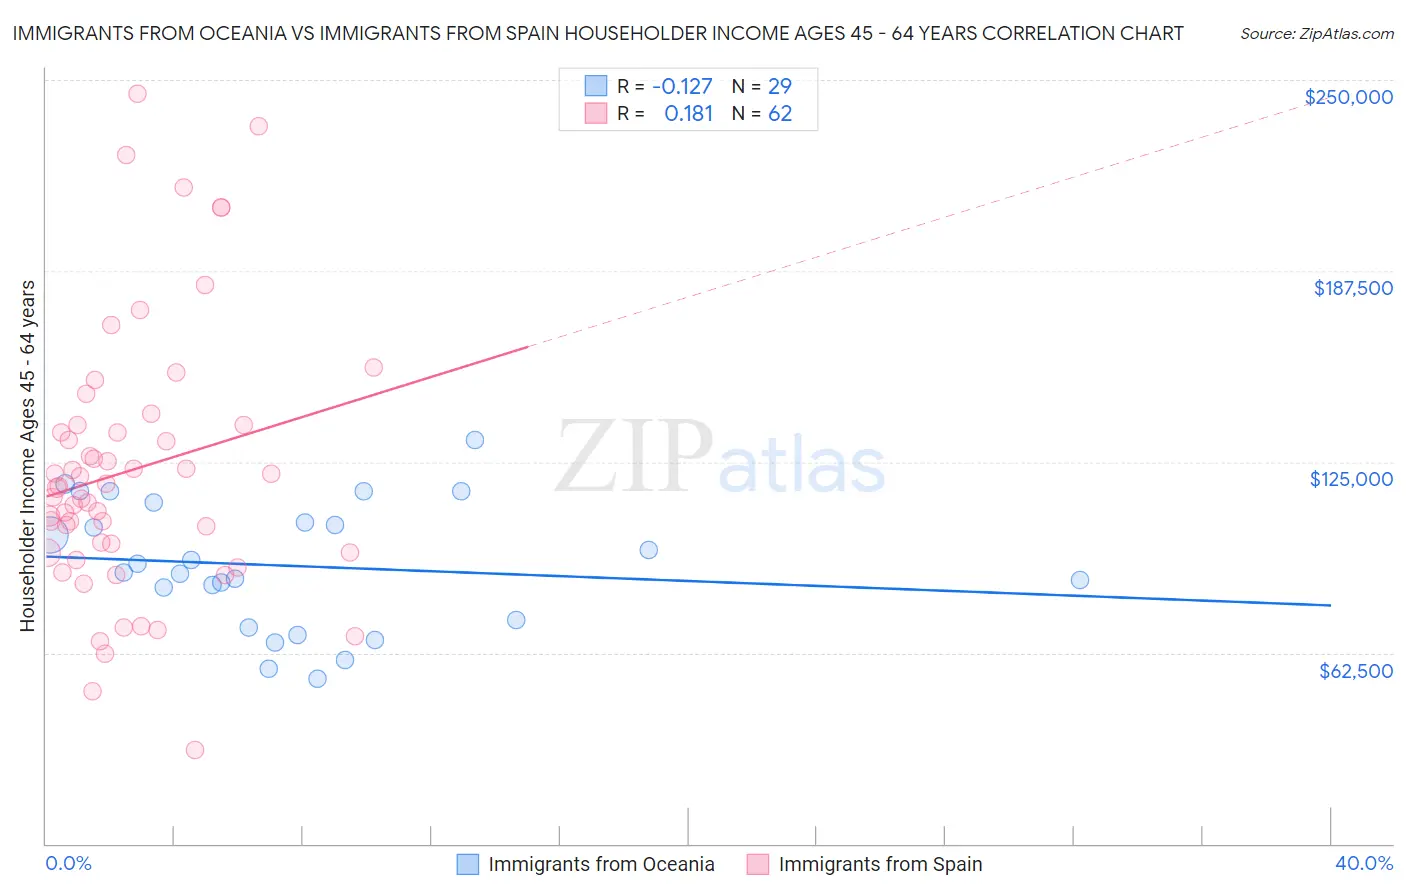
Immigrants from Oceania vs Immigrants from Spain Householder Income Ages 45 - 64 years Correlation Chart
The statistical analysis conducted on geographies consisting of 305,099,752 people shows a poor negative correlation between the proportion of Immigrants from Oceania and household income with householder between the ages 45 and 64 in the United States with a correlation coefficient (R) of -0.127 and weighted average of $103,705. Similarly, the statistical analysis conducted on geographies consisting of 239,440,989 people shows a poor positive correlation between the proportion of Immigrants from Spain and household income with householder between the ages 45 and 64 in the United States with a correlation coefficient (R) of 0.181 and weighted average of $109,051, a difference of 5.1%.
Householder Income Ages 45 - 64 years Correlation Summary
| Measurement | Immigrants from Oceania | Immigrants from Spain |
| Minimum | $53,935 | $30,870 |
| Maximum | $132,083 | $245,443 |
| Range | $78,148 | $214,573 |
| Mean | $90,991 | $122,412 |
| Median | $88,770 | $116,851 |
| Interquartile 25% (IQ1) | $72,125 | $95,313 |
| Interquartile 75% (IQ3) | $108,595 | $137,063 |
| Interquartile Range (IQR) | $36,470 | $41,750 |
| Standard Deviation (Sample) | $20,662 | $44,097 |
| Standard Deviation (Population) | $20,302 | $43,740 |
Similar Demographics by Householder Income Ages 45 - 64 years
Demographics Similar to Immigrants from Oceania by Householder Income Ages 45 - 64 years
In terms of householder income ages 45 - 64 years, the demographic groups most similar to Immigrants from Oceania are Norwegian ($103,682, a difference of 0.020%), Ethiopian ($103,736, a difference of 0.030%), Immigrants from Uganda ($103,584, a difference of 0.12%), Luxembourger ($103,536, a difference of 0.16%), and Serbian ($103,522, a difference of 0.18%).
| Demographics | Rating | Rank | Householder Income Ages 45 - 64 years |
| Lebanese | 90.1 /100 | #132 | Exceptional $104,734 |
| Arabs | 89.3 /100 | #133 | Excellent $104,566 |
| Canadians | 89.3 /100 | #134 | Excellent $104,560 |
| Brazilians | 88.6 /100 | #135 | Excellent $104,408 |
| Taiwanese | 87.4 /100 | #136 | Excellent $104,180 |
| Hungarians | 85.8 /100 | #137 | Excellent $103,913 |
| Ethiopians | 84.7 /100 | #138 | Excellent $103,736 |
| Immigrants | Oceania | 84.5 /100 | #139 | Excellent $103,705 |
| Norwegians | 84.3 /100 | #140 | Excellent $103,682 |
| Immigrants | Uganda | 83.7 /100 | #141 | Excellent $103,584 |
| Luxembourgers | 83.3 /100 | #142 | Excellent $103,536 |
| Serbians | 83.2 /100 | #143 | Excellent $103,522 |
| Czechs | 83.1 /100 | #144 | Excellent $103,507 |
| Ugandans | 82.9 /100 | #145 | Excellent $103,472 |
| Immigrants | Chile | 82.5 /100 | #146 | Excellent $103,412 |
Demographics Similar to Immigrants from Spain by Householder Income Ages 45 - 64 years
In terms of householder income ages 45 - 64 years, the demographic groups most similar to Immigrants from Spain are Immigrants from North America ($109,198, a difference of 0.14%), Immigrants from Western Europe ($108,824, a difference of 0.21%), Immigrants from Afghanistan ($108,785, a difference of 0.24%), Immigrants from Eastern Europe ($109,335, a difference of 0.26%), and Immigrants from Bulgaria ($109,379, a difference of 0.30%).
| Demographics | Rating | Rank | Householder Income Ages 45 - 64 years |
| Paraguayans | 99.0 /100 | #76 | Exceptional $109,447 |
| Immigrants | England | 99.0 /100 | #77 | Exceptional $109,446 |
| Immigrants | Canada | 99.0 /100 | #78 | Exceptional $109,402 |
| Immigrants | Bulgaria | 98.9 /100 | #79 | Exceptional $109,379 |
| Jordanians | 98.9 /100 | #80 | Exceptional $109,376 |
| Immigrants | Eastern Europe | 98.9 /100 | #81 | Exceptional $109,335 |
| Immigrants | North America | 98.8 /100 | #82 | Exceptional $109,198 |
| Immigrants | Spain | 98.8 /100 | #83 | Exceptional $109,051 |
| Immigrants | Western Europe | 98.6 /100 | #84 | Exceptional $108,824 |
| Immigrants | Afghanistan | 98.6 /100 | #85 | Exceptional $108,785 |
| Austrians | 98.5 /100 | #86 | Exceptional $108,692 |
| Tongans | 98.5 /100 | #87 | Exceptional $108,643 |
| Romanians | 98.5 /100 | #88 | Exceptional $108,609 |
| Ukrainians | 98.3 /100 | #89 | Exceptional $108,475 |
| Immigrants | Philippines | 98.3 /100 | #90 | Exceptional $108,471 |