Immigrants from Northern Europe vs Arab Median Earnings
COMPARE
Immigrants from Northern Europe
Arab
Median Earnings
Median Earnings Comparison
Immigrants from Northern Europe
Arabs
$53,872
MEDIAN EARNINGS
100.0/ 100
METRIC RATING
26th/ 347
METRIC RANK
$48,599
MEDIAN EARNINGS
95.4/ 100
METRIC RATING
121st/ 347
METRIC RANK
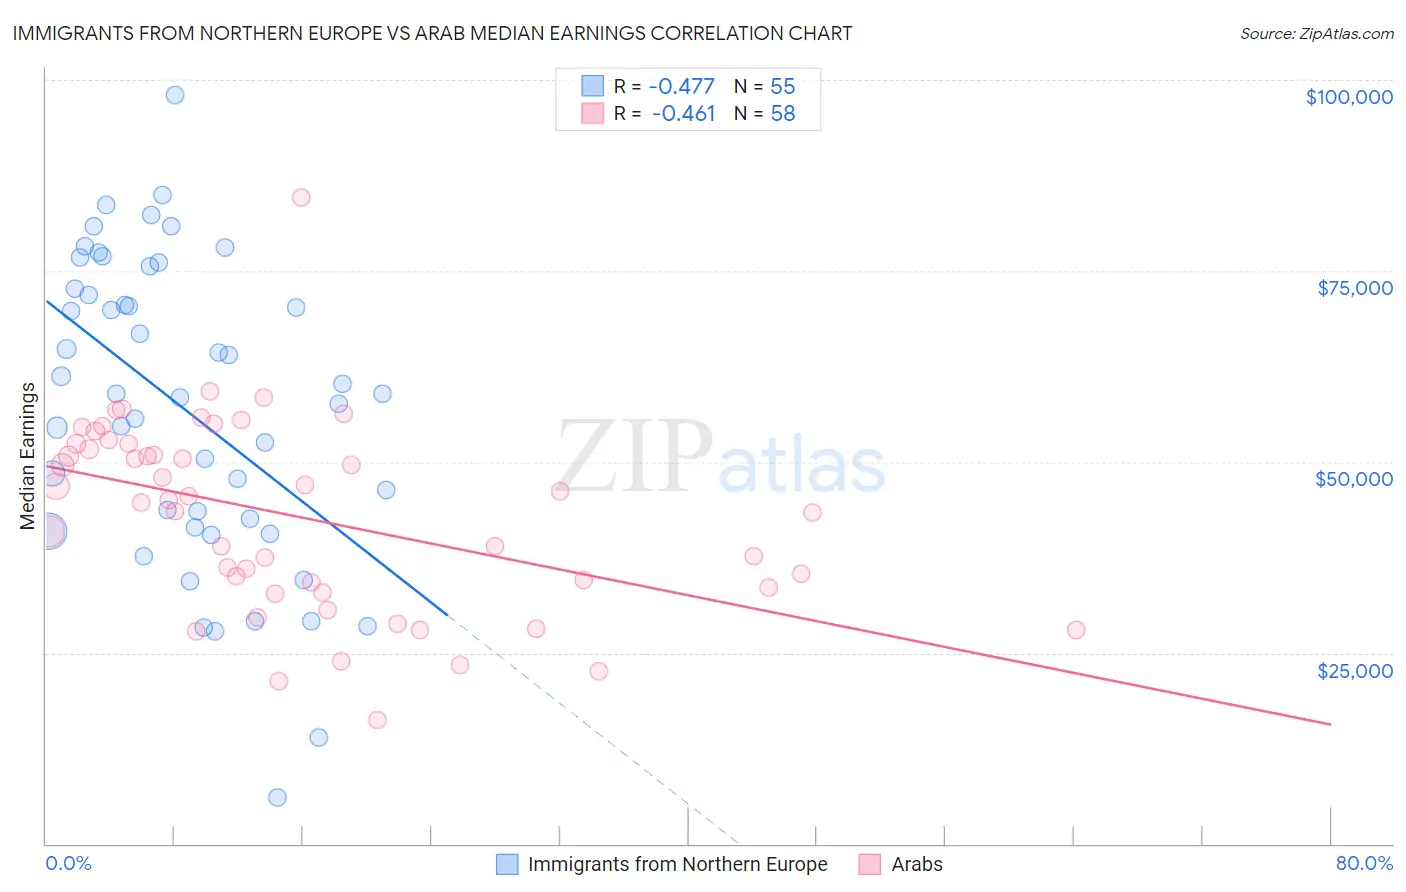
Immigrants from Northern Europe vs Arab Median Earnings Correlation Chart
The statistical analysis conducted on geographies consisting of 477,145,093 people shows a moderate negative correlation between the proportion of Immigrants from Northern Europe and median earnings in the United States with a correlation coefficient (R) of -0.477 and weighted average of $53,872. Similarly, the statistical analysis conducted on geographies consisting of 486,850,484 people shows a moderate negative correlation between the proportion of Arabs and median earnings in the United States with a correlation coefficient (R) of -0.461 and weighted average of $48,599, a difference of 10.8%.
Median Earnings Correlation Summary
| Measurement | Immigrants from Northern Europe | Arab |
| Minimum | $5,997 | $16,192 |
| Maximum | $98,000 | $84,560 |
| Range | $92,003 | $68,368 |
| Mean | $56,961 | $42,864 |
| Median | $58,943 | $44,810 |
| Interquartile 25% (IQ1) | $41,349 | $33,563 |
| Interquartile 75% (IQ3) | $72,683 | $52,424 |
| Interquartile Range (IQR) | $31,335 | $18,861 |
| Standard Deviation (Sample) | $19,840 | $12,577 |
| Standard Deviation (Population) | $19,659 | $12,468 |
Similar Demographics by Median Earnings
Demographics Similar to Immigrants from Northern Europe by Median Earnings
In terms of median earnings, the demographic groups most similar to Immigrants from Northern Europe are Turkish ($53,919, a difference of 0.090%), Asian ($53,690, a difference of 0.34%), Immigrants from France ($53,490, a difference of 0.71%), Soviet Union ($54,290, a difference of 0.78%), and Immigrants from Russia ($53,457, a difference of 0.78%).
| Demographics | Rating | Rank | Median Earnings |
| Immigrants | Belgium | 100.0 /100 | #19 | Exceptional $54,679 |
| Cypriots | 100.0 /100 | #20 | Exceptional $54,589 |
| Burmese | 100.0 /100 | #21 | Exceptional $54,559 |
| Immigrants | Korea | 100.0 /100 | #22 | Exceptional $54,530 |
| Immigrants | Sweden | 100.0 /100 | #23 | Exceptional $54,478 |
| Soviet Union | 100.0 /100 | #24 | Exceptional $54,290 |
| Turks | 100.0 /100 | #25 | Exceptional $53,919 |
| Immigrants | Northern Europe | 100.0 /100 | #26 | Exceptional $53,872 |
| Asians | 100.0 /100 | #27 | Exceptional $53,690 |
| Immigrants | France | 100.0 /100 | #28 | Exceptional $53,490 |
| Immigrants | Russia | 100.0 /100 | #29 | Exceptional $53,457 |
| Cambodians | 100.0 /100 | #30 | Exceptional $53,386 |
| Russians | 100.0 /100 | #31 | Exceptional $53,334 |
| Immigrants | Asia | 100.0 /100 | #32 | Exceptional $53,310 |
| Immigrants | Greece | 100.0 /100 | #33 | Exceptional $53,282 |
Demographics Similar to Arabs by Median Earnings
In terms of median earnings, the demographic groups most similar to Arabs are Carpatho Rusyn ($48,617, a difference of 0.040%), Polish ($48,659, a difference of 0.12%), Immigrants from Jordan ($48,673, a difference of 0.15%), Serbian ($48,677, a difference of 0.16%), and Chilean ($48,504, a difference of 0.19%).
| Demographics | Rating | Rank | Median Earnings |
| Moroccans | 96.7 /100 | #114 | Exceptional $48,838 |
| Chinese | 96.7 /100 | #115 | Exceptional $48,836 |
| Koreans | 96.2 /100 | #116 | Exceptional $48,727 |
| Serbians | 95.9 /100 | #117 | Exceptional $48,677 |
| Immigrants | Jordan | 95.9 /100 | #118 | Exceptional $48,673 |
| Poles | 95.8 /100 | #119 | Exceptional $48,659 |
| Carpatho Rusyns | 95.5 /100 | #120 | Exceptional $48,617 |
| Arabs | 95.4 /100 | #121 | Exceptional $48,599 |
| Chileans | 94.8 /100 | #122 | Exceptional $48,504 |
| Immigrants | Syria | 93.9 /100 | #123 | Exceptional $48,375 |
| Brazilians | 93.7 /100 | #124 | Exceptional $48,356 |
| Immigrants | Fiji | 93.3 /100 | #125 | Exceptional $48,305 |
| Assyrians/Chaldeans/Syriacs | 93.3 /100 | #126 | Exceptional $48,304 |
| Sierra Leoneans | 93.1 /100 | #127 | Exceptional $48,286 |
| Immigrants | Philippines | 92.9 /100 | #128 | Exceptional $48,266 |