Tohono O'odham vs Arab Median Earnings
COMPARE
Tohono O'odham
Arab
Median Earnings
Median Earnings Comparison
Tohono O'odham
Arabs
$36,349
MEDIAN EARNINGS
0.0/ 100
METRIC RATING
345th/ 347
METRIC RANK
$48,599
MEDIAN EARNINGS
95.4/ 100
METRIC RATING
121st/ 347
METRIC RANK
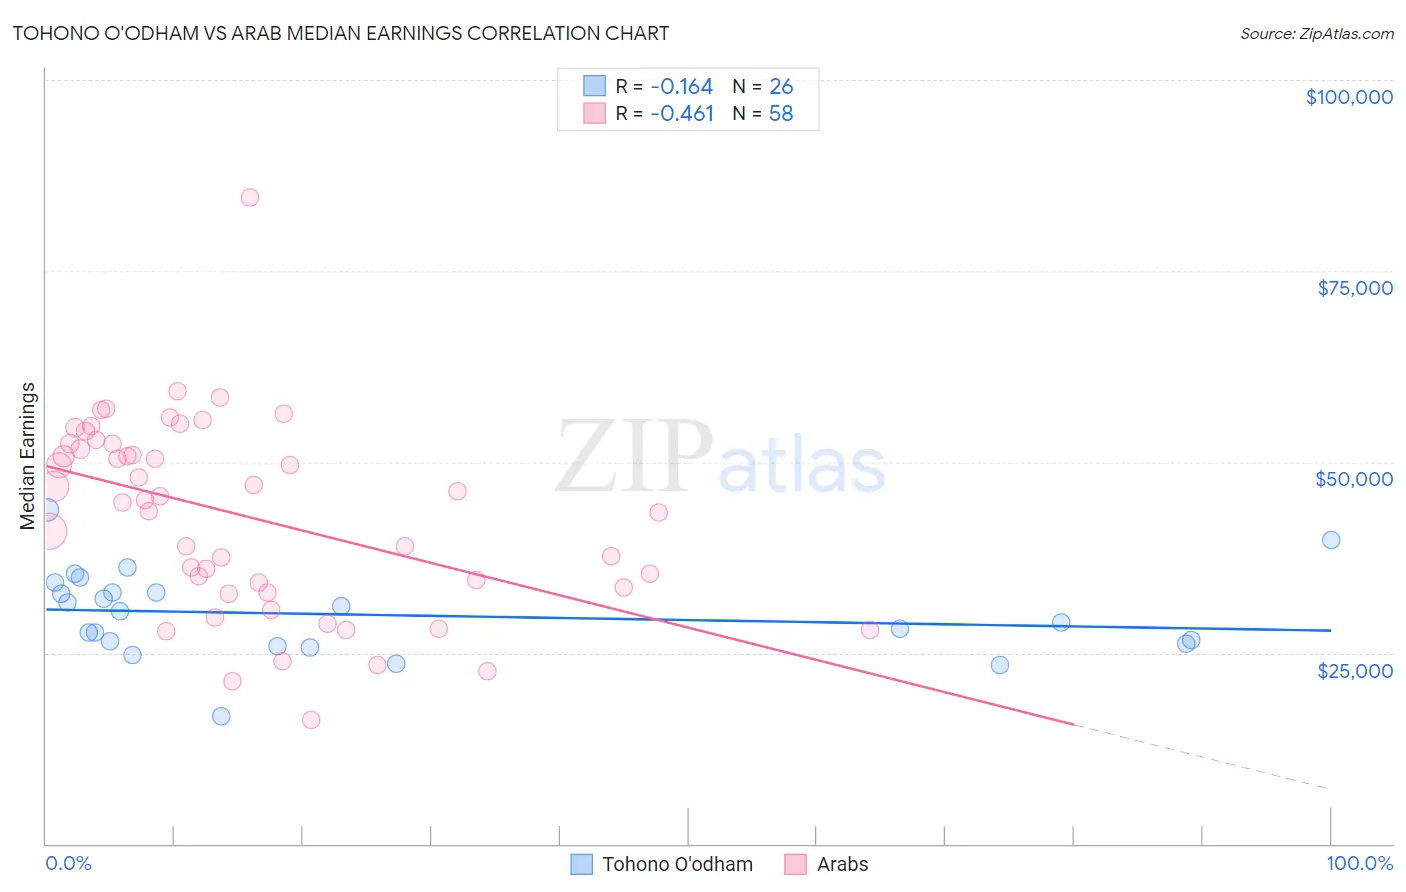
Tohono O'odham vs Arab Median Earnings Correlation Chart
The statistical analysis conducted on geographies consisting of 58,728,293 people shows a poor negative correlation between the proportion of Tohono O'odham and median earnings in the United States with a correlation coefficient (R) of -0.164 and weighted average of $36,349. Similarly, the statistical analysis conducted on geographies consisting of 486,850,484 people shows a moderate negative correlation between the proportion of Arabs and median earnings in the United States with a correlation coefficient (R) of -0.461 and weighted average of $48,599, a difference of 33.7%.
Median Earnings Correlation Summary
| Measurement | Tohono O'odham | Arab |
| Minimum | $16,641 | $16,192 |
| Maximum | $43,705 | $84,560 |
| Range | $27,064 | $68,368 |
| Mean | $29,971 | $42,864 |
| Median | $29,707 | $44,810 |
| Interquartile 25% (IQ1) | $26,250 | $33,563 |
| Interquartile 75% (IQ3) | $32,909 | $52,424 |
| Interquartile Range (IQR) | $6,659 | $18,861 |
| Standard Deviation (Sample) | $5,663 | $12,577 |
| Standard Deviation (Population) | $5,553 | $12,468 |
Similar Demographics by Median Earnings
Demographics Similar to Tohono O'odham by Median Earnings
In terms of median earnings, the demographic groups most similar to Tohono O'odham are Arapaho ($36,586, a difference of 0.65%), Yup'ik ($35,942, a difference of 1.1%), Pueblo ($36,859, a difference of 1.4%), Hopi ($36,871, a difference of 1.4%), and Lumbee ($36,876, a difference of 1.5%).
| Demographics | Rating | Rank | Median Earnings |
| Houma | 0.0 /100 | #333 | Tragic $38,949 |
| Spanish American Indians | 0.0 /100 | #334 | Tragic $38,907 |
| Natives/Alaskans | 0.0 /100 | #335 | Tragic $38,896 |
| Crow | 0.0 /100 | #336 | Tragic $38,707 |
| Immigrants | Cuba | 0.0 /100 | #337 | Tragic $38,426 |
| Pima | 0.0 /100 | #338 | Tragic $38,285 |
| Menominee | 0.0 /100 | #339 | Tragic $37,884 |
| Navajo | 0.0 /100 | #340 | Tragic $36,999 |
| Lumbee | 0.0 /100 | #341 | Tragic $36,876 |
| Hopi | 0.0 /100 | #342 | Tragic $36,871 |
| Pueblo | 0.0 /100 | #343 | Tragic $36,859 |
| Arapaho | 0.0 /100 | #344 | Tragic $36,586 |
| Tohono O'odham | 0.0 /100 | #345 | Tragic $36,349 |
| Yup'ik | 0.0 /100 | #346 | Tragic $35,942 |
| Puerto Ricans | 0.0 /100 | #347 | Tragic $35,560 |
Demographics Similar to Arabs by Median Earnings
In terms of median earnings, the demographic groups most similar to Arabs are Carpatho Rusyn ($48,617, a difference of 0.040%), Polish ($48,659, a difference of 0.12%), Immigrants from Jordan ($48,673, a difference of 0.15%), Serbian ($48,677, a difference of 0.16%), and Chilean ($48,504, a difference of 0.19%).
| Demographics | Rating | Rank | Median Earnings |
| Moroccans | 96.7 /100 | #114 | Exceptional $48,838 |
| Chinese | 96.7 /100 | #115 | Exceptional $48,836 |
| Koreans | 96.2 /100 | #116 | Exceptional $48,727 |
| Serbians | 95.9 /100 | #117 | Exceptional $48,677 |
| Immigrants | Jordan | 95.9 /100 | #118 | Exceptional $48,673 |
| Poles | 95.8 /100 | #119 | Exceptional $48,659 |
| Carpatho Rusyns | 95.5 /100 | #120 | Exceptional $48,617 |
| Arabs | 95.4 /100 | #121 | Exceptional $48,599 |
| Chileans | 94.8 /100 | #122 | Exceptional $48,504 |
| Immigrants | Syria | 93.9 /100 | #123 | Exceptional $48,375 |
| Brazilians | 93.7 /100 | #124 | Exceptional $48,356 |
| Immigrants | Fiji | 93.3 /100 | #125 | Exceptional $48,305 |
| Assyrians/Chaldeans/Syriacs | 93.3 /100 | #126 | Exceptional $48,304 |
| Sierra Leoneans | 93.1 /100 | #127 | Exceptional $48,286 |
| Immigrants | Philippines | 92.9 /100 | #128 | Exceptional $48,266 |