Immigrants from Northern Europe vs Arab 2nd Grade
COMPARE
Immigrants from Northern Europe
Arab
2nd Grade
2nd Grade Comparison
Immigrants from Northern Europe
Arabs
98.3%
2ND GRADE
99.7/ 100
METRIC RATING
67th/ 347
METRIC RANK
97.8%
2ND GRADE
36.9/ 100
METRIC RATING
186th/ 347
METRIC RANK
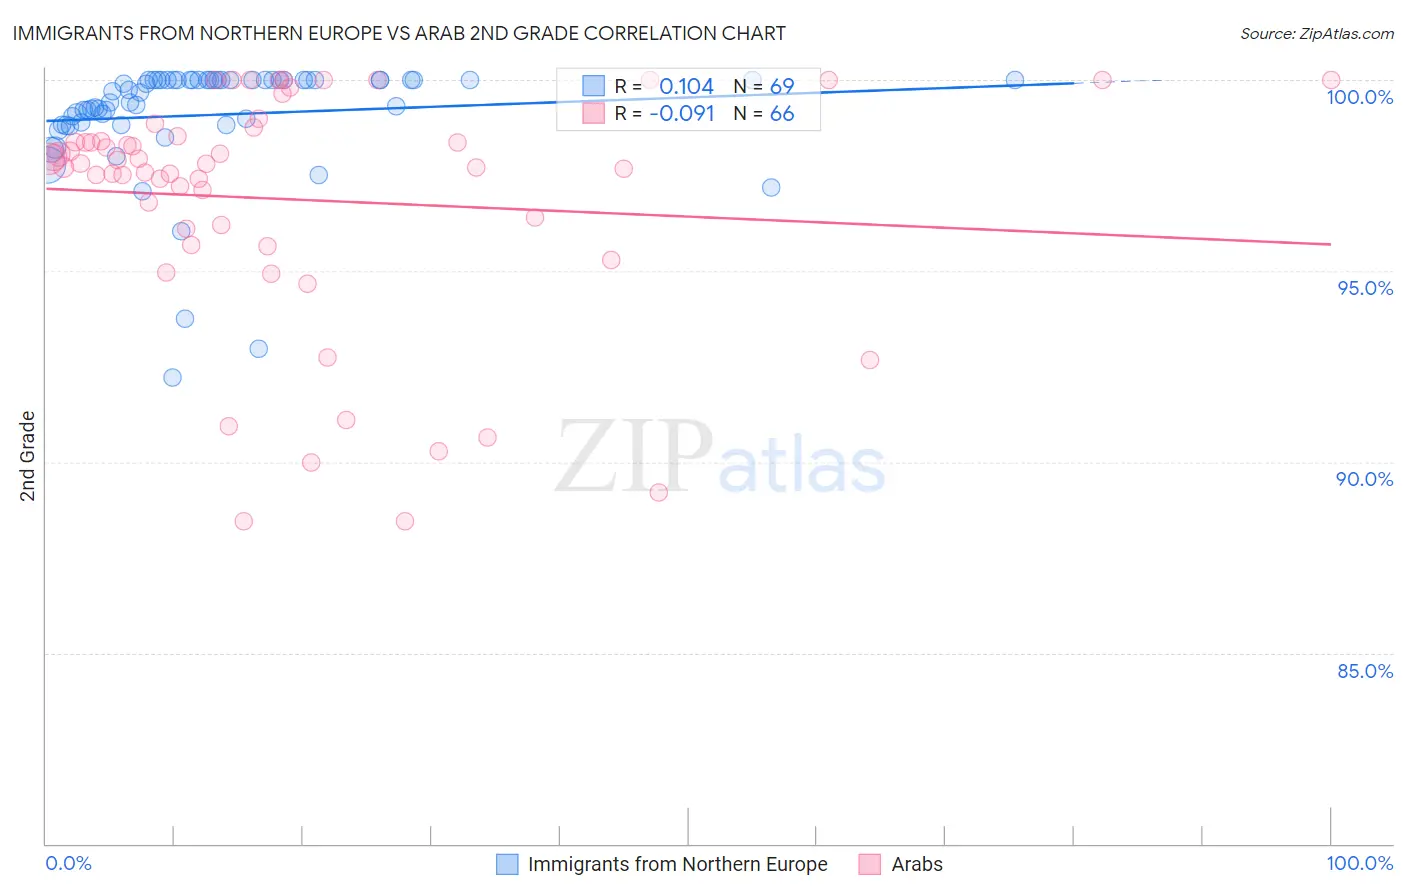
Immigrants from Northern Europe vs Arab 2nd Grade Correlation Chart
The statistical analysis conducted on geographies consisting of 477,226,800 people shows a poor positive correlation between the proportion of Immigrants from Northern Europe and percentage of population with at least 2nd grade education in the United States with a correlation coefficient (R) of 0.104 and weighted average of 98.3%. Similarly, the statistical analysis conducted on geographies consisting of 486,872,222 people shows a slight negative correlation between the proportion of Arabs and percentage of population with at least 2nd grade education in the United States with a correlation coefficient (R) of -0.091 and weighted average of 97.8%, a difference of 0.49%.
2nd Grade Correlation Summary
| Measurement | Immigrants from Northern Europe | Arab |
| Minimum | 92.2% | 88.4% |
| Maximum | 100.0% | 100.0% |
| Range | 7.8% | 11.6% |
| Mean | 99.1% | 96.9% |
| Median | 99.7% | 97.8% |
| Interquartile 25% (IQ1) | 98.8% | 96.1% |
| Interquartile 75% (IQ3) | 100.0% | 98.5% |
| Interquartile Range (IQR) | 1.2% | 2.4% |
| Standard Deviation (Sample) | 1.6% | 3.1% |
| Standard Deviation (Population) | 1.6% | 3.1% |
Similar Demographics by 2nd Grade
Demographics Similar to Immigrants from Northern Europe by 2nd Grade
In terms of 2nd grade, the demographic groups most similar to Immigrants from Northern Europe are Canadian (98.3%, a difference of 0.0%), Russian (98.3%, a difference of 0.0%), Immigrants from Austria (98.3%, a difference of 0.0%), Serbian (98.3%, a difference of 0.0%), and Chickasaw (98.3%, a difference of 0.010%).
| Demographics | Rating | Rank | 2nd Grade |
| Creek | 99.8 /100 | #60 | Exceptional 98.3% |
| Immigrants | Canada | 99.8 /100 | #61 | Exceptional 98.3% |
| Greeks | 99.8 /100 | #62 | Exceptional 98.3% |
| Maltese | 99.7 /100 | #63 | Exceptional 98.3% |
| Immigrants | North America | 99.7 /100 | #64 | Exceptional 98.3% |
| New Zealanders | 99.7 /100 | #65 | Exceptional 98.3% |
| Canadians | 99.7 /100 | #66 | Exceptional 98.3% |
| Immigrants | Northern Europe | 99.7 /100 | #67 | Exceptional 98.3% |
| Russians | 99.7 /100 | #68 | Exceptional 98.3% |
| Immigrants | Austria | 99.6 /100 | #69 | Exceptional 98.3% |
| Serbians | 99.6 /100 | #70 | Exceptional 98.3% |
| Chickasaw | 99.6 /100 | #71 | Exceptional 98.3% |
| Cheyenne | 99.6 /100 | #72 | Exceptional 98.3% |
| Cajuns | 99.5 /100 | #73 | Exceptional 98.3% |
| Immigrants | Netherlands | 99.4 /100 | #74 | Exceptional 98.3% |
Demographics Similar to Arabs by 2nd Grade
In terms of 2nd grade, the demographic groups most similar to Arabs are Pakistani (97.8%, a difference of 0.0%), Immigrants from Kazakhstan (97.8%, a difference of 0.0%), Immigrants from Argentina (97.8%, a difference of 0.010%), Panamanian (97.8%, a difference of 0.010%), and Native/Alaskan (97.9%, a difference of 0.020%).
| Demographics | Rating | Rank | 2nd Grade |
| Immigrants | Venezuela | 46.1 /100 | #179 | Average 97.9% |
| Natives/Alaskans | 44.3 /100 | #180 | Average 97.9% |
| Egyptians | 44.3 /100 | #181 | Average 97.9% |
| Portuguese | 42.4 /100 | #182 | Average 97.8% |
| Immigrants | Poland | 42.2 /100 | #183 | Average 97.8% |
| Immigrants | Belarus | 41.5 /100 | #184 | Average 97.8% |
| Immigrants | Argentina | 40.6 /100 | #185 | Average 97.8% |
| Arabs | 36.9 /100 | #186 | Fair 97.8% |
| Pakistanis | 36.1 /100 | #187 | Fair 97.8% |
| Immigrants | Kazakhstan | 35.6 /100 | #188 | Fair 97.8% |
| Panamanians | 33.5 /100 | #189 | Fair 97.8% |
| Immigrants | Taiwan | 31.8 /100 | #190 | Fair 97.8% |
| Paraguayans | 30.8 /100 | #191 | Fair 97.8% |
| Blacks/African Americans | 29.9 /100 | #192 | Fair 97.8% |
| Hawaiians | 28.5 /100 | #193 | Fair 97.8% |