Immigrants from Ecuador vs Arab Median Earnings
COMPARE
Immigrants from Ecuador
Arab
Median Earnings
Median Earnings Comparison
Immigrants from Ecuador
Arabs
$44,462
MEDIAN EARNINGS
5.9/ 100
METRIC RATING
237th/ 347
METRIC RANK
$48,599
MEDIAN EARNINGS
95.4/ 100
METRIC RATING
121st/ 347
METRIC RANK
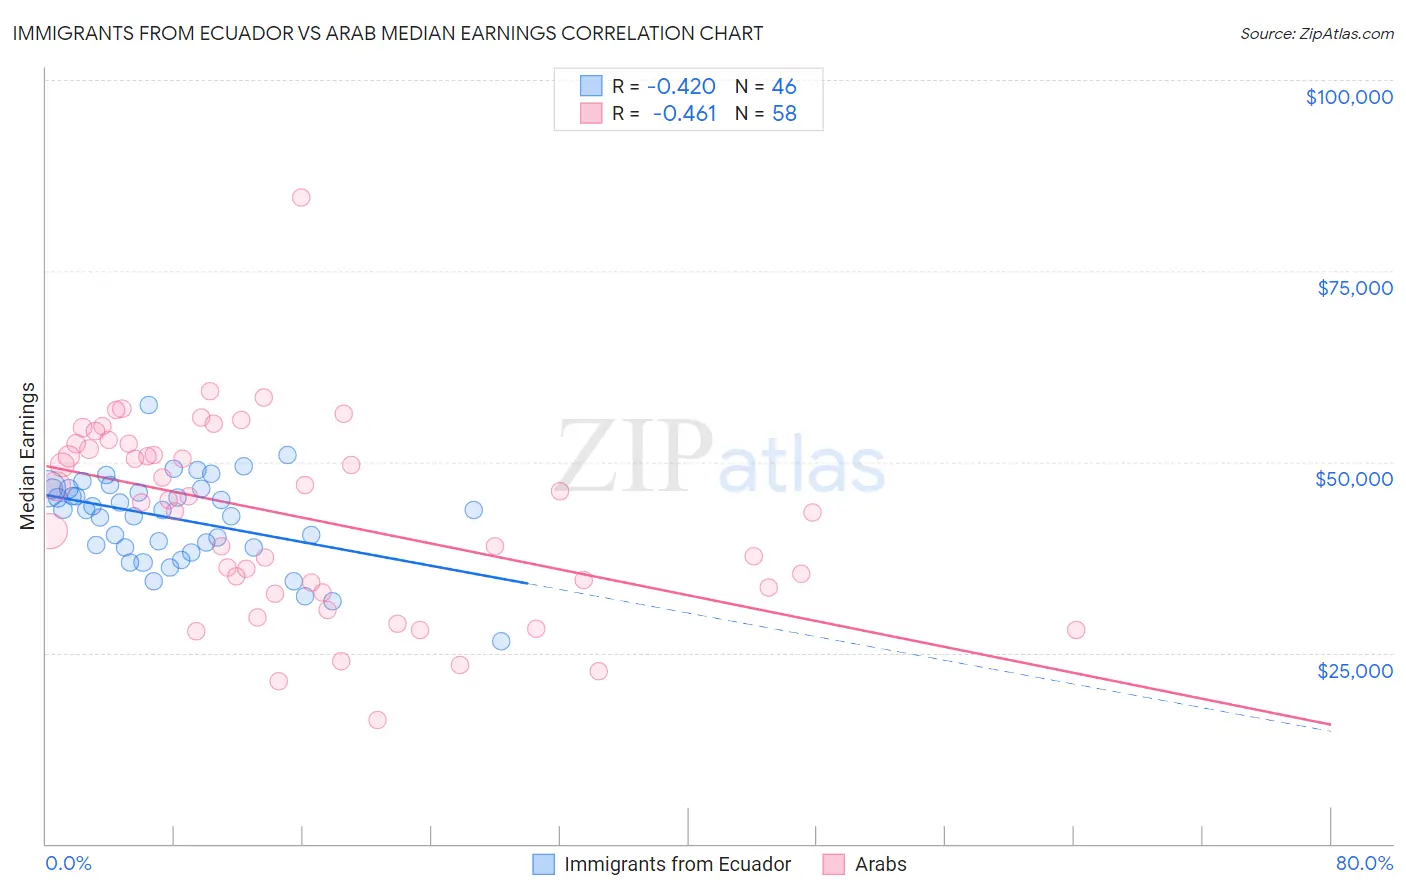
Immigrants from Ecuador vs Arab Median Earnings Correlation Chart
The statistical analysis conducted on geographies consisting of 271,003,938 people shows a moderate negative correlation between the proportion of Immigrants from Ecuador and median earnings in the United States with a correlation coefficient (R) of -0.420 and weighted average of $44,462. Similarly, the statistical analysis conducted on geographies consisting of 486,850,484 people shows a moderate negative correlation between the proportion of Arabs and median earnings in the United States with a correlation coefficient (R) of -0.461 and weighted average of $48,599, a difference of 9.3%.
Median Earnings Correlation Summary
| Measurement | Immigrants from Ecuador | Arab |
| Minimum | $26,500 | $16,192 |
| Maximum | $57,428 | $84,560 |
| Range | $30,928 | $68,368 |
| Mean | $42,586 | $42,864 |
| Median | $43,711 | $44,810 |
| Interquartile 25% (IQ1) | $38,859 | $33,563 |
| Interquartile 75% (IQ3) | $46,439 | $52,424 |
| Interquartile Range (IQR) | $7,579 | $18,861 |
| Standard Deviation (Sample) | $5,767 | $12,577 |
| Standard Deviation (Population) | $5,704 | $12,468 |
Similar Demographics by Median Earnings
Demographics Similar to Immigrants from Ecuador by Median Earnings
In terms of median earnings, the demographic groups most similar to Immigrants from Ecuador are Sudanese ($44,419, a difference of 0.10%), British West Indian ($44,552, a difference of 0.20%), Senegalese ($44,373, a difference of 0.20%), Venezuelan ($44,580, a difference of 0.27%), and Cape Verdean ($44,640, a difference of 0.40%).
| Demographics | Rating | Rank | Median Earnings |
| Immigrants | Western Africa | 10.3 /100 | #230 | Poor $44,893 |
| Japanese | 9.5 /100 | #231 | Tragic $44,825 |
| Delaware | 9.0 /100 | #232 | Tragic $44,783 |
| Immigrants | Sudan | 8.8 /100 | #233 | Tragic $44,767 |
| Cape Verdeans | 7.5 /100 | #234 | Tragic $44,640 |
| Venezuelans | 6.9 /100 | #235 | Tragic $44,580 |
| British West Indians | 6.7 /100 | #236 | Tragic $44,552 |
| Immigrants | Ecuador | 5.9 /100 | #237 | Tragic $44,462 |
| Sudanese | 5.6 /100 | #238 | Tragic $44,419 |
| Senegalese | 5.3 /100 | #239 | Tragic $44,373 |
| Aleuts | 4.4 /100 | #240 | Tragic $44,241 |
| Samoans | 4.2 /100 | #241 | Tragic $44,206 |
| Immigrants | Venezuela | 4.0 /100 | #242 | Tragic $44,163 |
| Sub-Saharan Africans | 3.7 /100 | #243 | Tragic $44,118 |
| Immigrants | Nonimmigrants | 3.7 /100 | #244 | Tragic $44,117 |
Demographics Similar to Arabs by Median Earnings
In terms of median earnings, the demographic groups most similar to Arabs are Carpatho Rusyn ($48,617, a difference of 0.040%), Polish ($48,659, a difference of 0.12%), Immigrants from Jordan ($48,673, a difference of 0.15%), Serbian ($48,677, a difference of 0.16%), and Chilean ($48,504, a difference of 0.19%).
| Demographics | Rating | Rank | Median Earnings |
| Moroccans | 96.7 /100 | #114 | Exceptional $48,838 |
| Chinese | 96.7 /100 | #115 | Exceptional $48,836 |
| Koreans | 96.2 /100 | #116 | Exceptional $48,727 |
| Serbians | 95.9 /100 | #117 | Exceptional $48,677 |
| Immigrants | Jordan | 95.9 /100 | #118 | Exceptional $48,673 |
| Poles | 95.8 /100 | #119 | Exceptional $48,659 |
| Carpatho Rusyns | 95.5 /100 | #120 | Exceptional $48,617 |
| Arabs | 95.4 /100 | #121 | Exceptional $48,599 |
| Chileans | 94.8 /100 | #122 | Exceptional $48,504 |
| Immigrants | Syria | 93.9 /100 | #123 | Exceptional $48,375 |
| Brazilians | 93.7 /100 | #124 | Exceptional $48,356 |
| Immigrants | Fiji | 93.3 /100 | #125 | Exceptional $48,305 |
| Assyrians/Chaldeans/Syriacs | 93.3 /100 | #126 | Exceptional $48,304 |
| Sierra Leoneans | 93.1 /100 | #127 | Exceptional $48,286 |
| Immigrants | Philippines | 92.9 /100 | #128 | Exceptional $48,266 |