Immigrants from Northern Europe vs Arab 1st Grade
COMPARE
Immigrants from Northern Europe
Arab
1st Grade
1st Grade Comparison
Immigrants from Northern Europe
Arabs
98.3%
1ST GRADE
99.6/ 100
METRIC RATING
68th/ 347
METRIC RANK
97.9%
1ST GRADE
35.5/ 100
METRIC RATING
188th/ 347
METRIC RANK
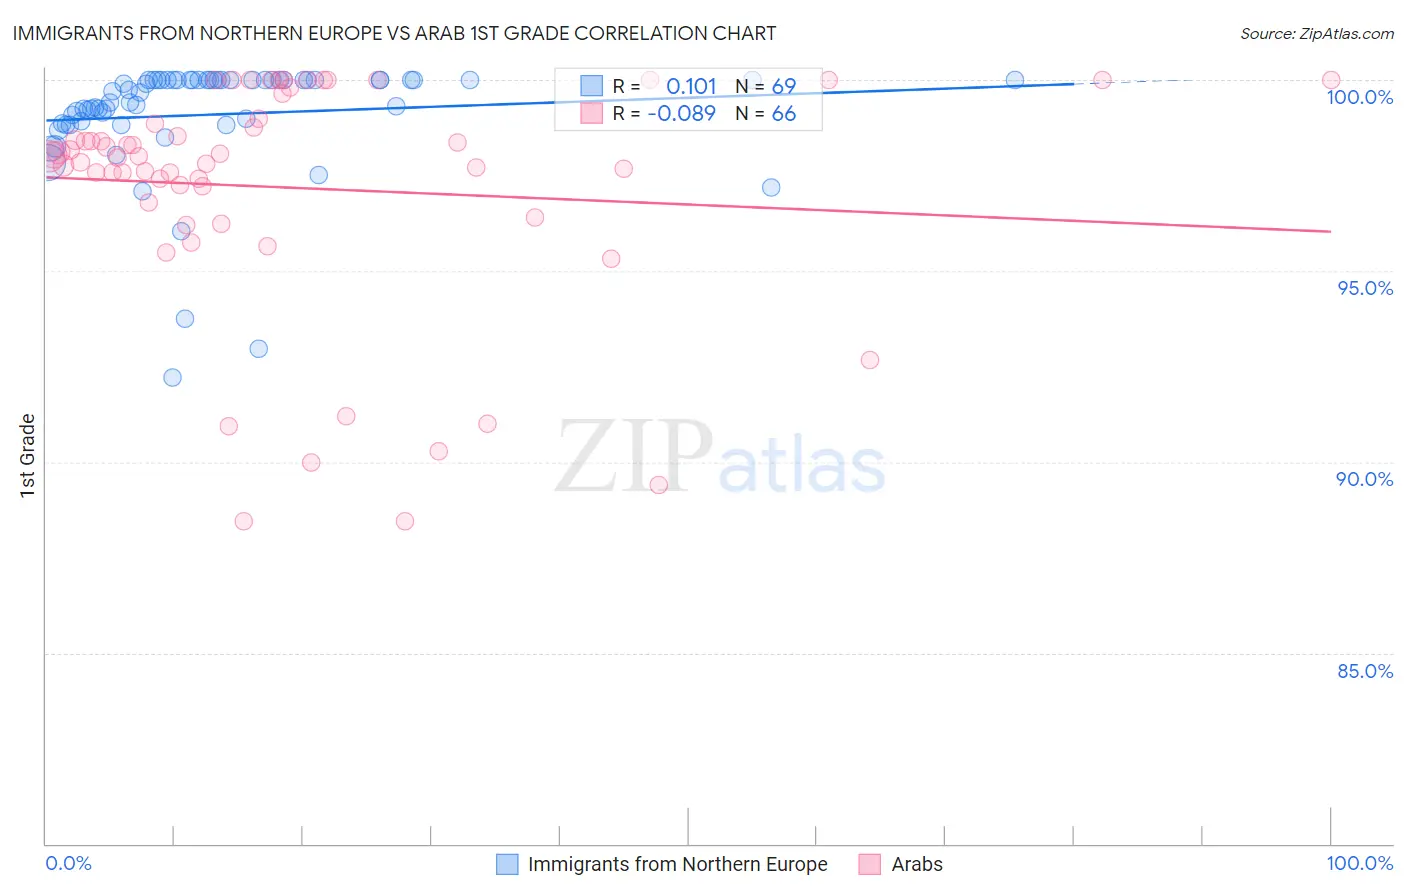
Immigrants from Northern Europe vs Arab 1st Grade Correlation Chart
The statistical analysis conducted on geographies consisting of 477,226,800 people shows a poor positive correlation between the proportion of Immigrants from Northern Europe and percentage of population with at least 1st grade education in the United States with a correlation coefficient (R) of 0.101 and weighted average of 98.3%. Similarly, the statistical analysis conducted on geographies consisting of 486,872,222 people shows a slight negative correlation between the proportion of Arabs and percentage of population with at least 1st grade education in the United States with a correlation coefficient (R) of -0.089 and weighted average of 97.9%, a difference of 0.48%.
1st Grade Correlation Summary
| Measurement | Immigrants from Northern Europe | Arab |
| Minimum | 92.2% | 88.4% |
| Maximum | 100.0% | 100.0% |
| Range | 7.8% | 11.6% |
| Mean | 99.1% | 97.2% |
| Median | 99.7% | 98.0% |
| Interquartile 25% (IQ1) | 98.8% | 96.8% |
| Interquartile 75% (IQ3) | 100.0% | 99.0% |
| Interquartile Range (IQR) | 1.2% | 2.2% |
| Standard Deviation (Sample) | 1.6% | 3.1% |
| Standard Deviation (Population) | 1.6% | 3.0% |
Similar Demographics by 1st Grade
Demographics Similar to Immigrants from Northern Europe by 1st Grade
In terms of 1st grade, the demographic groups most similar to Immigrants from Northern Europe are Canadian (98.3%, a difference of 0.0%), Immigrants from Austria (98.3%, a difference of 0.0%), Chickasaw (98.3%, a difference of 0.0%), Russian (98.3%, a difference of 0.0%), and Serbian (98.3%, a difference of 0.0%).
| Demographics | Rating | Rank | 1st Grade |
| Bulgarians | 99.7 /100 | #61 | Exceptional 98.4% |
| Slavs | 99.7 /100 | #62 | Exceptional 98.4% |
| Immigrants | North America | 99.7 /100 | #63 | Exceptional 98.4% |
| Greeks | 99.7 /100 | #64 | Exceptional 98.4% |
| Maltese | 99.7 /100 | #65 | Exceptional 98.4% |
| Canadians | 99.6 /100 | #66 | Exceptional 98.3% |
| Immigrants | Austria | 99.6 /100 | #67 | Exceptional 98.3% |
| Immigrants | Northern Europe | 99.6 /100 | #68 | Exceptional 98.3% |
| Chickasaw | 99.6 /100 | #69 | Exceptional 98.3% |
| Russians | 99.6 /100 | #70 | Exceptional 98.3% |
| Serbians | 99.6 /100 | #71 | Exceptional 98.3% |
| Cheyenne | 99.6 /100 | #72 | Exceptional 98.3% |
| Cajuns | 99.5 /100 | #73 | Exceptional 98.3% |
| Immigrants | Netherlands | 99.4 /100 | #74 | Exceptional 98.3% |
| Cherokee | 99.3 /100 | #75 | Exceptional 98.3% |
Demographics Similar to Arabs by 1st Grade
In terms of 1st grade, the demographic groups most similar to Arabs are Paiute (97.9%, a difference of 0.0%), Pakistani (97.9%, a difference of 0.0%), Immigrants from Kazakhstan (97.9%, a difference of 0.0%), Panamanian (97.9%, a difference of 0.0%), and Immigrants from Belarus (97.9%, a difference of 0.010%).
| Demographics | Rating | Rank | 1st Grade |
| Portuguese | 44.2 /100 | #181 | Average 97.9% |
| Egyptians | 42.7 /100 | #182 | Average 97.9% |
| Immigrants | Argentina | 41.3 /100 | #183 | Average 97.9% |
| Immigrants | Poland | 40.1 /100 | #184 | Average 97.9% |
| Immigrants | Belarus | 39.3 /100 | #185 | Fair 97.9% |
| Paiute | 36.5 /100 | #186 | Fair 97.9% |
| Pakistanis | 35.8 /100 | #187 | Fair 97.9% |
| Arabs | 35.5 /100 | #188 | Fair 97.9% |
| Immigrants | Kazakhstan | 34.9 /100 | #189 | Fair 97.9% |
| Panamanians | 34.1 /100 | #190 | Fair 97.9% |
| Blacks/African Americans | 30.7 /100 | #191 | Fair 97.9% |
| Paraguayans | 30.2 /100 | #192 | Fair 97.9% |
| Immigrants | Taiwan | 29.4 /100 | #193 | Fair 97.9% |
| Mongolians | 29.2 /100 | #194 | Fair 97.9% |
| Hawaiians | 28.8 /100 | #195 | Fair 97.9% |