Immigrants from North Macedonia vs Slavic Median Household Income
COMPARE
Immigrants from North Macedonia
Slavic
Median Household Income
Median Household Income Comparison
Immigrants from North Macedonia
Slavs
$89,741
MEDIAN HOUSEHOLD INCOME
95.2/ 100
METRIC RATING
120th/ 347
METRIC RANK
$86,398
MEDIAN HOUSEHOLD INCOME
69.7/ 100
METRIC RATING
161st/ 347
METRIC RANK
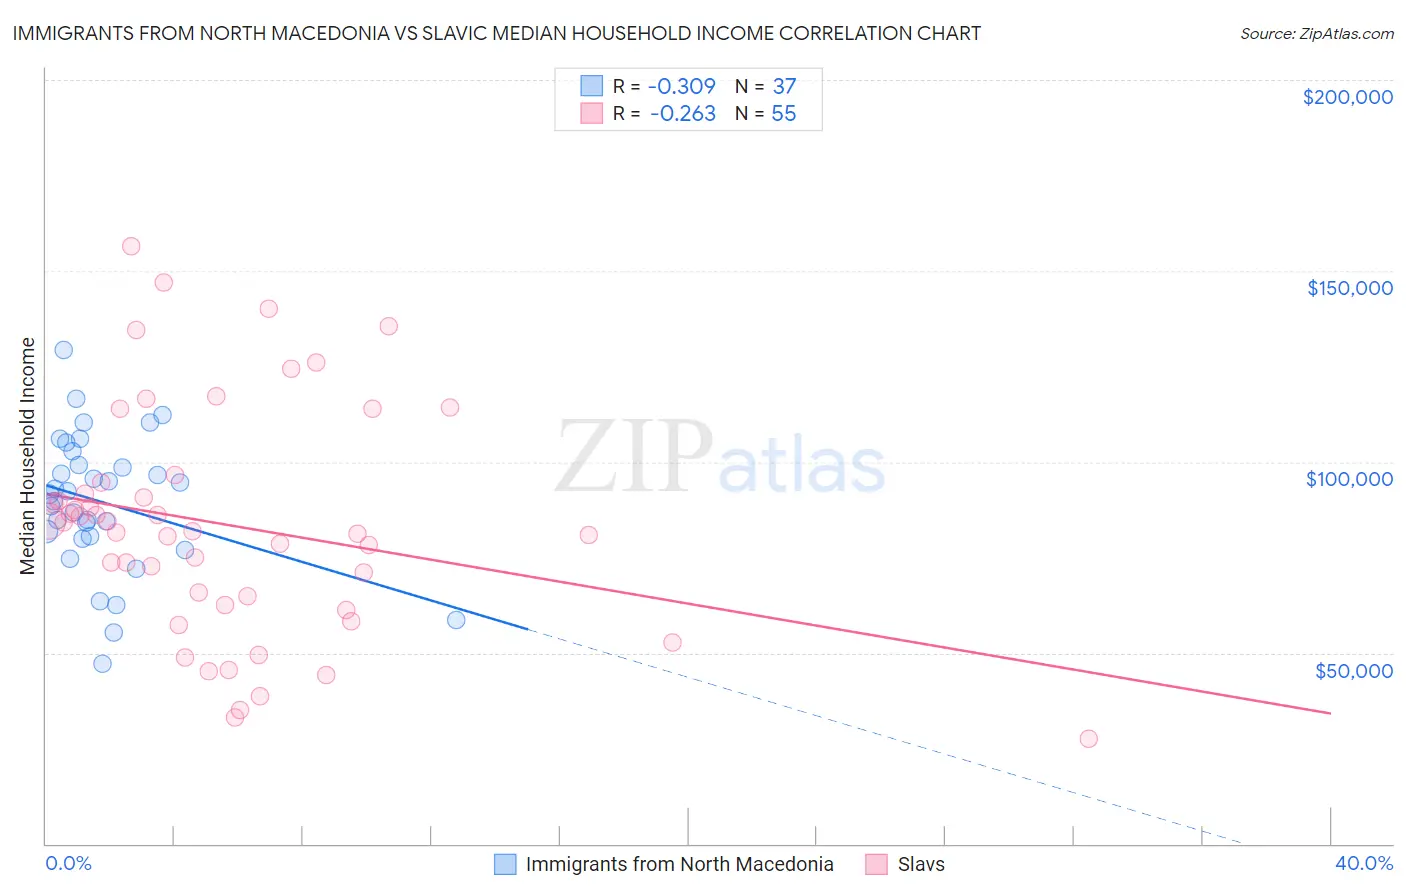
Immigrants from North Macedonia vs Slavic Median Household Income Correlation Chart
The statistical analysis conducted on geographies consisting of 74,304,962 people shows a mild negative correlation between the proportion of Immigrants from North Macedonia and median household income in the United States with a correlation coefficient (R) of -0.309 and weighted average of $89,741. Similarly, the statistical analysis conducted on geographies consisting of 270,777,755 people shows a weak negative correlation between the proportion of Slavs and median household income in the United States with a correlation coefficient (R) of -0.263 and weighted average of $86,398, a difference of 3.9%.
Median Household Income Correlation Summary
| Measurement | Immigrants from North Macedonia | Slavic |
| Minimum | $47,094 | $27,389 |
| Maximum | $129,437 | $156,479 |
| Range | $82,343 | $129,090 |
| Mean | $89,408 | $83,350 |
| Median | $91,504 | $81,875 |
| Interquartile 25% (IQ1) | $80,151 | $62,500 |
| Interquartile 75% (IQ3) | $100,949 | $94,752 |
| Interquartile Range (IQR) | $20,798 | $32,252 |
| Standard Deviation (Sample) | $17,826 | $29,906 |
| Standard Deviation (Population) | $17,584 | $29,633 |
Similar Demographics by Median Household Income
Demographics Similar to Immigrants from North Macedonia by Median Household Income
In terms of median household income, the demographic groups most similar to Immigrants from North Macedonia are Albanian ($89,744, a difference of 0.0%), Syrian ($89,830, a difference of 0.10%), Ethiopian ($89,640, a difference of 0.11%), Pakistani ($89,638, a difference of 0.11%), and Taiwanese ($89,900, a difference of 0.18%).
| Demographics | Rating | Rank | Median Household Income |
| Peruvians | 96.5 /100 | #113 | Exceptional $90,261 |
| Immigrants | Northern Africa | 95.9 /100 | #114 | Exceptional $90,026 |
| Immigrants | Western Asia | 95.9 /100 | #115 | Exceptional $90,005 |
| Native Hawaiians | 95.7 /100 | #116 | Exceptional $89,919 |
| Taiwanese | 95.6 /100 | #117 | Exceptional $89,900 |
| Syrians | 95.4 /100 | #118 | Exceptional $89,830 |
| Albanians | 95.2 /100 | #119 | Exceptional $89,744 |
| Immigrants | North Macedonia | 95.2 /100 | #120 | Exceptional $89,741 |
| Ethiopians | 94.9 /100 | #121 | Exceptional $89,640 |
| Pakistanis | 94.8 /100 | #122 | Exceptional $89,638 |
| Immigrants | Zimbabwe | 94.4 /100 | #123 | Exceptional $89,496 |
| Immigrants | Jordan | 94.1 /100 | #124 | Exceptional $89,412 |
| Immigrants | Kuwait | 93.5 /100 | #125 | Exceptional $89,263 |
| Immigrants | Oceania | 92.9 /100 | #126 | Exceptional $89,100 |
| Immigrants | Peru | 92.5 /100 | #127 | Exceptional $89,010 |
Demographics Similar to Slavs by Median Household Income
In terms of median household income, the demographic groups most similar to Slavs are Luxembourger ($86,418, a difference of 0.020%), Immigrants from Uzbekistan ($86,425, a difference of 0.030%), Moroccan ($86,468, a difference of 0.080%), Samoan ($86,498, a difference of 0.12%), and Immigrants from Albania ($86,534, a difference of 0.16%).
| Demographics | Rating | Rank | Median Household Income |
| Immigrants | Germany | 74.4 /100 | #154 | Good $86,764 |
| Carpatho Rusyns | 72.8 /100 | #155 | Good $86,635 |
| Immigrants | Albania | 71.5 /100 | #156 | Good $86,534 |
| Samoans | 71.0 /100 | #157 | Good $86,498 |
| Moroccans | 70.6 /100 | #158 | Good $86,468 |
| Immigrants | Uzbekistan | 70.1 /100 | #159 | Good $86,425 |
| Luxembourgers | 70.0 /100 | #160 | Good $86,418 |
| Slavs | 69.7 /100 | #161 | Good $86,398 |
| Guamanians/Chamorros | 67.7 /100 | #162 | Good $86,255 |
| Czechs | 66.4 /100 | #163 | Good $86,164 |
| Irish | 66.2 /100 | #164 | Good $86,145 |
| Norwegians | 65.3 /100 | #165 | Good $86,084 |
| Scandinavians | 65.1 /100 | #166 | Good $86,073 |
| Immigrants | Immigrants | 61.3 /100 | #167 | Good $85,818 |
| Icelanders | 61.0 /100 | #168 | Good $85,797 |