Immigrants from North Macedonia vs Tsimshian Householder Income Ages 45 - 64 years
COMPARE
Immigrants from North Macedonia
Tsimshian
Householder Income Ages 45 - 64 years
Householder Income Ages 45 - 64 years Comparison
Immigrants from North Macedonia
Tsimshian
$105,892
HOUSEHOLDER INCOME AGES 45 - 64 YEARS
94.2/ 100
METRIC RATING
122nd/ 347
METRIC RANK
$96,783
HOUSEHOLDER INCOME AGES 45 - 64 YEARS
14.5/ 100
METRIC RATING
210th/ 347
METRIC RANK
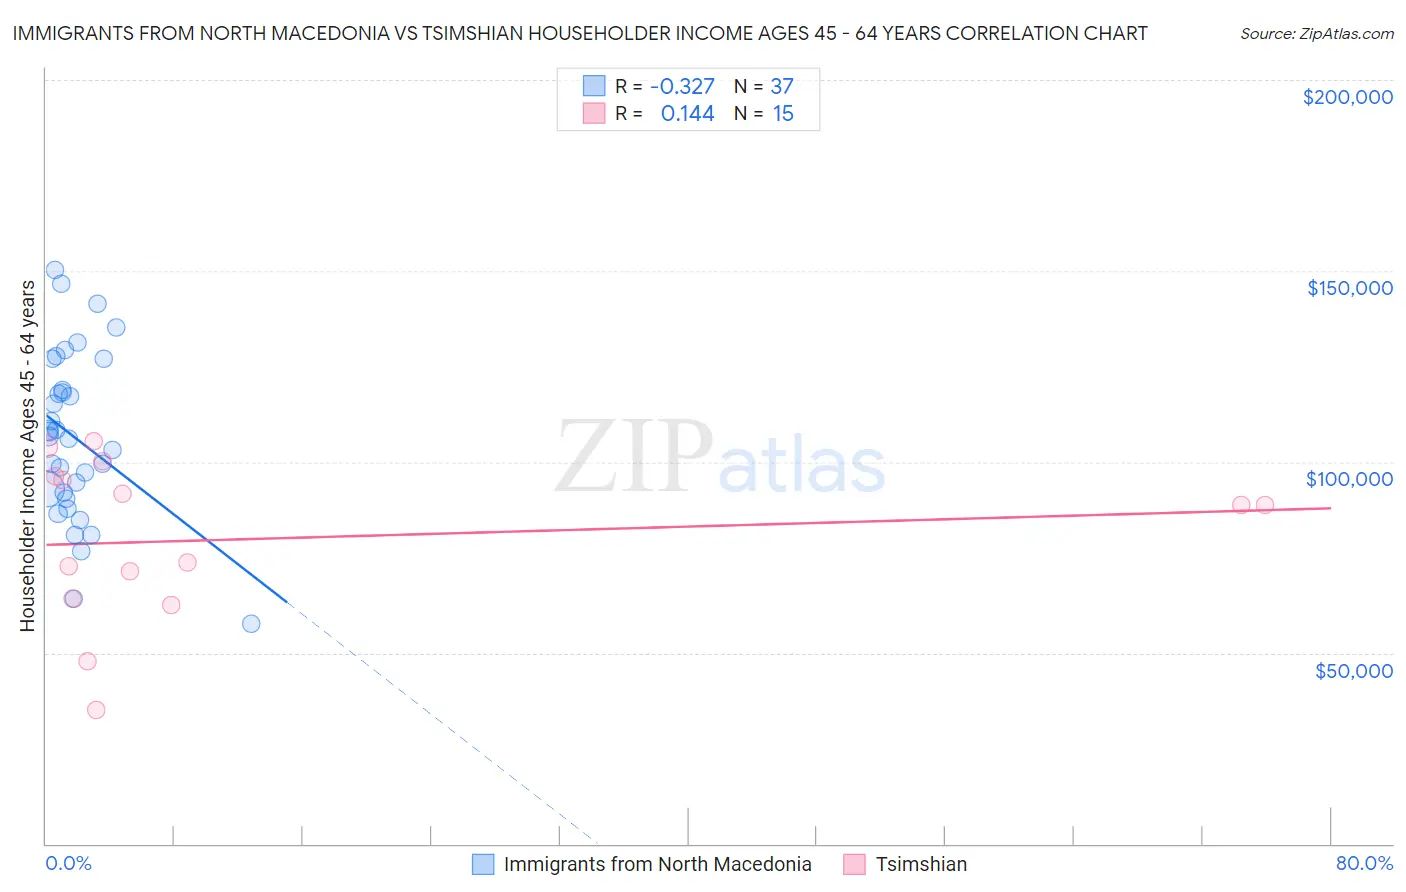
Immigrants from North Macedonia vs Tsimshian Householder Income Ages 45 - 64 years Correlation Chart
The statistical analysis conducted on geographies consisting of 74,276,475 people shows a mild negative correlation between the proportion of Immigrants from North Macedonia and household income with householder between the ages 45 and 64 in the United States with a correlation coefficient (R) of -0.327 and weighted average of $105,892. Similarly, the statistical analysis conducted on geographies consisting of 15,616,673 people shows a poor positive correlation between the proportion of Tsimshian and household income with householder between the ages 45 and 64 in the United States with a correlation coefficient (R) of 0.144 and weighted average of $96,783, a difference of 9.4%.
Householder Income Ages 45 - 64 years Correlation Summary
| Measurement | Immigrants from North Macedonia | Tsimshian |
| Minimum | $57,692 | $35,000 |
| Maximum | $150,188 | $105,417 |
| Range | $92,496 | $70,417 |
| Mean | $106,443 | $79,823 |
| Median | $106,642 | $88,750 |
| Interquartile 25% (IQ1) | $91,237 | $64,063 |
| Interquartile 75% (IQ3) | $122,928 | $96,327 |
| Interquartile Range (IQR) | $31,692 | $32,264 |
| Standard Deviation (Sample) | $21,888 | $21,070 |
| Standard Deviation (Population) | $21,590 | $20,355 |
Similar Demographics by Householder Income Ages 45 - 64 years
Demographics Similar to Immigrants from North Macedonia by Householder Income Ages 45 - 64 years
In terms of householder income ages 45 - 64 years, the demographic groups most similar to Immigrants from North Macedonia are Polish ($105,952, a difference of 0.060%), Immigrants from South Eastern Asia ($106,109, a difference of 0.20%), Immigrants from Jordan ($106,164, a difference of 0.26%), Danish ($105,619, a difference of 0.26%), and Immigrants from Western Asia ($106,217, a difference of 0.31%).
| Demographics | Rating | Rank | Householder Income Ages 45 - 64 years |
| Immigrants | Kuwait | 95.2 /100 | #115 | Exceptional $106,285 |
| British | 95.2 /100 | #116 | Exceptional $106,264 |
| Albanians | 95.1 /100 | #117 | Exceptional $106,243 |
| Immigrants | Western Asia | 95.0 /100 | #118 | Exceptional $106,217 |
| Immigrants | Jordan | 94.9 /100 | #119 | Exceptional $106,164 |
| Immigrants | South Eastern Asia | 94.8 /100 | #120 | Exceptional $106,109 |
| Poles | 94.4 /100 | #121 | Exceptional $105,952 |
| Immigrants | North Macedonia | 94.2 /100 | #122 | Exceptional $105,892 |
| Danes | 93.4 /100 | #123 | Exceptional $105,619 |
| Immigrants | Northern Africa | 92.8 /100 | #124 | Exceptional $105,430 |
| Pakistanis | 92.4 /100 | #125 | Exceptional $105,317 |
| Portuguese | 92.4 /100 | #126 | Exceptional $105,309 |
| Immigrants | Saudi Arabia | 92.2 /100 | #127 | Exceptional $105,249 |
| Native Hawaiians | 91.8 /100 | #128 | Exceptional $105,149 |
| Peruvians | 91.5 /100 | #129 | Exceptional $105,070 |
Demographics Similar to Tsimshian by Householder Income Ages 45 - 64 years
In terms of householder income ages 45 - 64 years, the demographic groups most similar to Tsimshian are Japanese ($96,834, a difference of 0.050%), Immigrants from Cambodia ($96,537, a difference of 0.26%), Scotch-Irish ($97,073, a difference of 0.30%), Venezuelan ($96,460, a difference of 0.34%), and Ghanaian ($97,277, a difference of 0.51%).
| Demographics | Rating | Rank | Householder Income Ages 45 - 64 years |
| Immigrants | Thailand | 18.8 /100 | #203 | Poor $97,400 |
| Immigrants | Eritrea | 18.6 /100 | #204 | Poor $97,373 |
| Immigrants | Colombia | 18.0 /100 | #205 | Poor $97,290 |
| Immigrants | Africa | 17.9 /100 | #206 | Poor $97,284 |
| Ghanaians | 17.9 /100 | #207 | Poor $97,277 |
| Scotch-Irish | 16.4 /100 | #208 | Poor $97,073 |
| Japanese | 14.8 /100 | #209 | Poor $96,834 |
| Tsimshian | 14.5 /100 | #210 | Poor $96,783 |
| Immigrants | Cambodia | 13.0 /100 | #211 | Poor $96,537 |
| Venezuelans | 12.6 /100 | #212 | Poor $96,460 |
| Immigrants | Uruguay | 10.7 /100 | #213 | Poor $96,086 |
| Panamanians | 10.6 /100 | #214 | Poor $96,066 |
| Nigerians | 8.2 /100 | #215 | Tragic $95,492 |
| Immigrants | Venezuela | 7.6 /100 | #216 | Tragic $95,342 |
| Immigrants | Ghana | 6.4 /100 | #217 | Tragic $94,982 |