Immigrants from North Macedonia vs Polish Householder Income Ages 45 - 64 years
COMPARE
Immigrants from North Macedonia
Polish
Householder Income Ages 45 - 64 years
Householder Income Ages 45 - 64 years Comparison
Immigrants from North Macedonia
Poles
$105,892
HOUSEHOLDER INCOME AGES 45 - 64 YEARS
94.2/ 100
METRIC RATING
122nd/ 347
METRIC RANK
$105,952
HOUSEHOLDER INCOME AGES 45 - 64 YEARS
94.4/ 100
METRIC RATING
121st/ 347
METRIC RANK
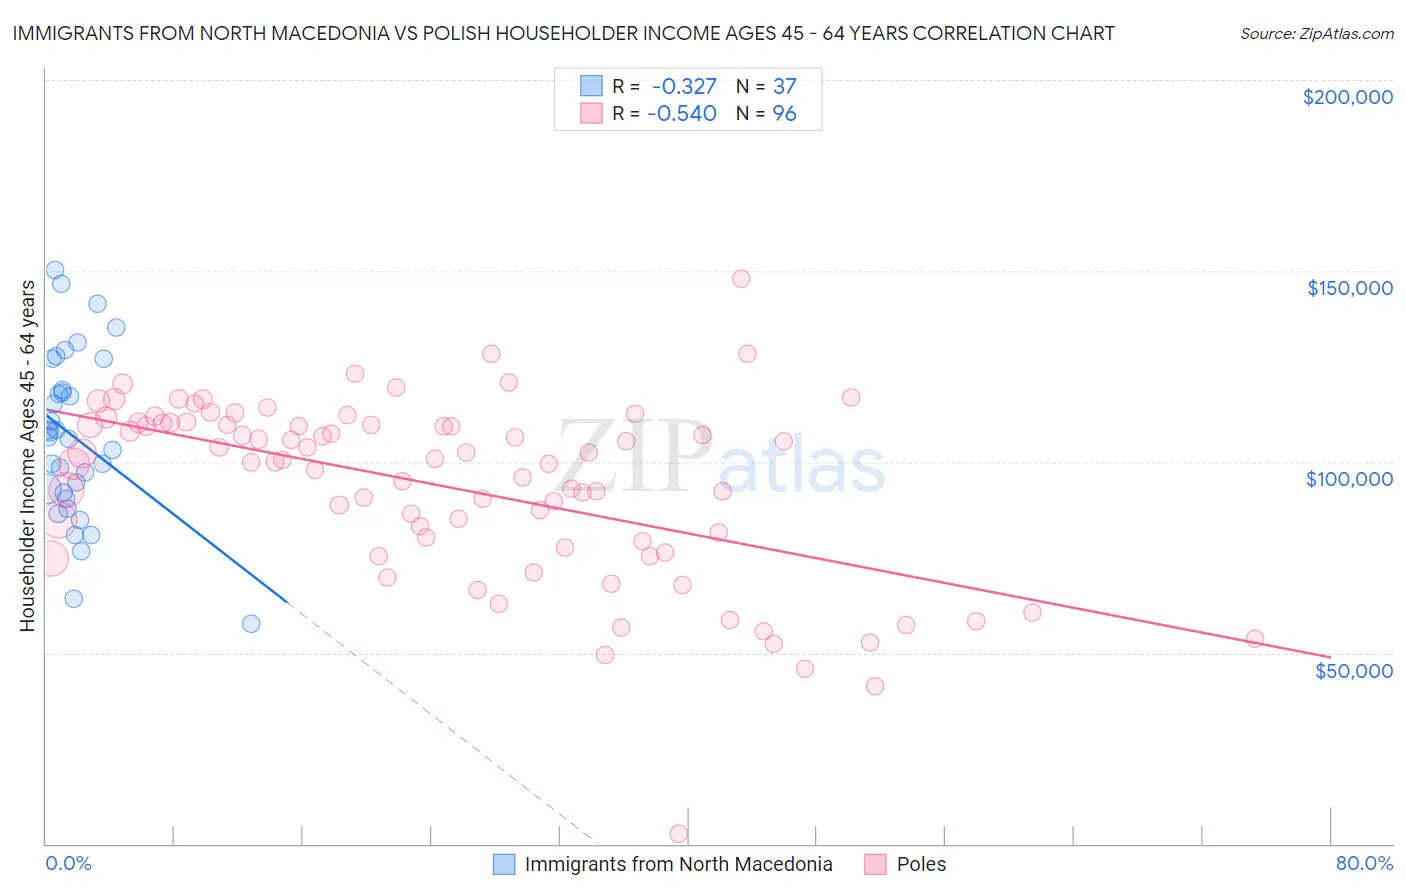
Immigrants from North Macedonia vs Polish Householder Income Ages 45 - 64 years Correlation Chart
The statistical analysis conducted on geographies consisting of 74,276,475 people shows a mild negative correlation between the proportion of Immigrants from North Macedonia and household income with householder between the ages 45 and 64 in the United States with a correlation coefficient (R) of -0.327 and weighted average of $105,892. Similarly, the statistical analysis conducted on geographies consisting of 557,394,661 people shows a substantial negative correlation between the proportion of Poles and household income with householder between the ages 45 and 64 in the United States with a correlation coefficient (R) of -0.540 and weighted average of $105,952, a difference of 0.060%.
Householder Income Ages 45 - 64 years Correlation Summary
| Measurement | Immigrants from North Macedonia | Polish |
| Minimum | $57,692 | $2,499 |
| Maximum | $150,188 | $147,814 |
| Range | $92,496 | $145,315 |
| Mean | $106,443 | $93,436 |
| Median | $106,642 | $100,304 |
| Interquartile 25% (IQ1) | $91,237 | $78,490 |
| Interquartile 75% (IQ3) | $122,928 | $109,945 |
| Interquartile Range (IQR) | $31,692 | $31,456 |
| Standard Deviation (Sample) | $21,888 | $23,791 |
| Standard Deviation (Population) | $21,590 | $23,667 |
Demographics Similar to Immigrants from North Macedonia and Poles by Householder Income Ages 45 - 64 years
In terms of householder income ages 45 - 64 years, the demographic groups most similar to Immigrants from North Macedonia are Immigrants from South Eastern Asia ($106,109, a difference of 0.20%), Immigrants from Jordan ($106,164, a difference of 0.26%), Danish ($105,619, a difference of 0.26%), Immigrants from Western Asia ($106,217, a difference of 0.31%), and Albanian ($106,243, a difference of 0.33%). Similarly, the demographic groups most similar to Poles are Immigrants from South Eastern Asia ($106,109, a difference of 0.15%), Immigrants from Jordan ($106,164, a difference of 0.20%), Immigrants from Western Asia ($106,217, a difference of 0.25%), Albanian ($106,243, a difference of 0.27%), and British ($106,264, a difference of 0.29%).
| Demographics | Rating | Rank | Householder Income Ages 45 - 64 years |
| Immigrants | Vietnam | 95.5 /100 | #111 | Exceptional $106,417 |
| Swedes | 95.4 /100 | #112 | Exceptional $106,377 |
| Europeans | 95.4 /100 | #113 | Exceptional $106,367 |
| Immigrants | Poland | 95.3 /100 | #114 | Exceptional $106,319 |
| Immigrants | Kuwait | 95.2 /100 | #115 | Exceptional $106,285 |
| British | 95.2 /100 | #116 | Exceptional $106,264 |
| Albanians | 95.1 /100 | #117 | Exceptional $106,243 |
| Immigrants | Western Asia | 95.0 /100 | #118 | Exceptional $106,217 |
| Immigrants | Jordan | 94.9 /100 | #119 | Exceptional $106,164 |
| Immigrants | South Eastern Asia | 94.8 /100 | #120 | Exceptional $106,109 |
| Poles | 94.4 /100 | #121 | Exceptional $105,952 |
| Immigrants | North Macedonia | 94.2 /100 | #122 | Exceptional $105,892 |
| Danes | 93.4 /100 | #123 | Exceptional $105,619 |
| Immigrants | Northern Africa | 92.8 /100 | #124 | Exceptional $105,430 |
| Pakistanis | 92.4 /100 | #125 | Exceptional $105,317 |
| Portuguese | 92.4 /100 | #126 | Exceptional $105,309 |
| Immigrants | Saudi Arabia | 92.2 /100 | #127 | Exceptional $105,249 |
| Native Hawaiians | 91.8 /100 | #128 | Exceptional $105,149 |
| Peruvians | 91.5 /100 | #129 | Exceptional $105,070 |
| Immigrants | Zimbabwe | 91.2 /100 | #130 | Exceptional $104,992 |
| Immigrants | Syria | 90.7 /100 | #131 | Exceptional $104,858 |