Immigrants from North Macedonia vs Zimbabwean Householder Income Ages 45 - 64 years
COMPARE
Immigrants from North Macedonia
Zimbabwean
Householder Income Ages 45 - 64 years
Householder Income Ages 45 - 64 years Comparison
Immigrants from North Macedonia
Zimbabweans
$105,892
HOUSEHOLDER INCOME AGES 45 - 64 YEARS
94.2/ 100
METRIC RATING
122nd/ 347
METRIC RANK
$106,849
HOUSEHOLDER INCOME AGES 45 - 64 YEARS
96.3/ 100
METRIC RATING
108th/ 347
METRIC RANK
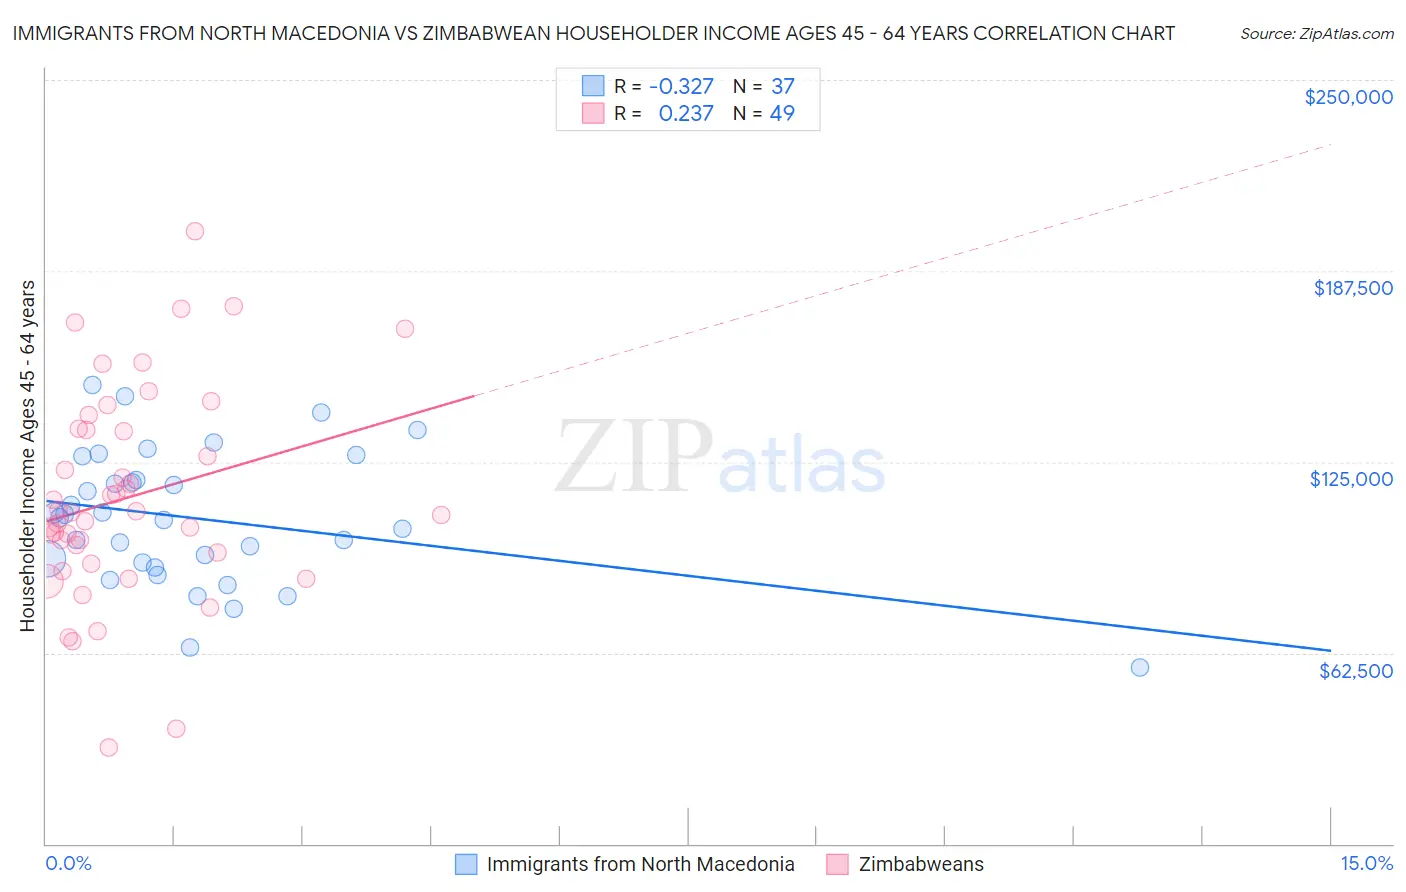
Immigrants from North Macedonia vs Zimbabwean Householder Income Ages 45 - 64 years Correlation Chart
The statistical analysis conducted on geographies consisting of 74,276,475 people shows a mild negative correlation between the proportion of Immigrants from North Macedonia and household income with householder between the ages 45 and 64 in the United States with a correlation coefficient (R) of -0.327 and weighted average of $105,892. Similarly, the statistical analysis conducted on geographies consisting of 69,179,320 people shows a weak positive correlation between the proportion of Zimbabweans and household income with householder between the ages 45 and 64 in the United States with a correlation coefficient (R) of 0.237 and weighted average of $106,849, a difference of 0.90%.
Householder Income Ages 45 - 64 years Correlation Summary
| Measurement | Immigrants from North Macedonia | Zimbabwean |
| Minimum | $57,692 | $31,641 |
| Maximum | $150,188 | $200,450 |
| Range | $92,496 | $168,809 |
| Mean | $106,443 | $113,309 |
| Median | $106,642 | $108,283 |
| Interquartile 25% (IQ1) | $91,237 | $93,481 |
| Interquartile 75% (IQ3) | $122,928 | $135,585 |
| Interquartile Range (IQR) | $31,692 | $42,104 |
| Standard Deviation (Sample) | $21,888 | $34,490 |
| Standard Deviation (Population) | $21,590 | $34,136 |
Demographics Similar to Immigrants from North Macedonia and Zimbabweans by Householder Income Ages 45 - 64 years
In terms of householder income ages 45 - 64 years, the demographic groups most similar to Immigrants from North Macedonia are Polish ($105,952, a difference of 0.060%), Immigrants from South Eastern Asia ($106,109, a difference of 0.20%), Immigrants from Jordan ($106,164, a difference of 0.26%), Danish ($105,619, a difference of 0.26%), and Immigrants from Western Asia ($106,217, a difference of 0.31%). Similarly, the demographic groups most similar to Zimbabweans are Immigrants from Fiji ($106,952, a difference of 0.10%), Armenian ($107,002, a difference of 0.14%), Macedonian ($107,074, a difference of 0.21%), Chilean ($106,611, a difference of 0.22%), and Immigrants from Brazil ($106,470, a difference of 0.36%).
| Demographics | Rating | Rank | Householder Income Ages 45 - 64 years |
| Macedonians | 96.7 /100 | #105 | Exceptional $107,074 |
| Armenians | 96.6 /100 | #106 | Exceptional $107,002 |
| Immigrants | Fiji | 96.5 /100 | #107 | Exceptional $106,952 |
| Zimbabweans | 96.3 /100 | #108 | Exceptional $106,849 |
| Chileans | 95.9 /100 | #109 | Exceptional $106,611 |
| Immigrants | Brazil | 95.6 /100 | #110 | Exceptional $106,470 |
| Immigrants | Vietnam | 95.5 /100 | #111 | Exceptional $106,417 |
| Swedes | 95.4 /100 | #112 | Exceptional $106,377 |
| Europeans | 95.4 /100 | #113 | Exceptional $106,367 |
| Immigrants | Poland | 95.3 /100 | #114 | Exceptional $106,319 |
| Immigrants | Kuwait | 95.2 /100 | #115 | Exceptional $106,285 |
| British | 95.2 /100 | #116 | Exceptional $106,264 |
| Albanians | 95.1 /100 | #117 | Exceptional $106,243 |
| Immigrants | Western Asia | 95.0 /100 | #118 | Exceptional $106,217 |
| Immigrants | Jordan | 94.9 /100 | #119 | Exceptional $106,164 |
| Immigrants | South Eastern Asia | 94.8 /100 | #120 | Exceptional $106,109 |
| Poles | 94.4 /100 | #121 | Exceptional $105,952 |
| Immigrants | North Macedonia | 94.2 /100 | #122 | Exceptional $105,892 |
| Danes | 93.4 /100 | #123 | Exceptional $105,619 |
| Immigrants | Northern Africa | 92.8 /100 | #124 | Exceptional $105,430 |
| Pakistanis | 92.4 /100 | #125 | Exceptional $105,317 |