Immigrants from North Macedonia vs Norwegian Cognitive Disability
COMPARE
Immigrants from North Macedonia
Norwegian
Cognitive Disability
Cognitive Disability Comparison
Immigrants from North Macedonia
Norwegians
16.3%
COGNITIVE DISABILITY
100.0/ 100
METRIC RATING
17th/ 347
METRIC RANK
16.5%
COGNITIVE DISABILITY
99.8/ 100
METRIC RATING
50th/ 347
METRIC RANK
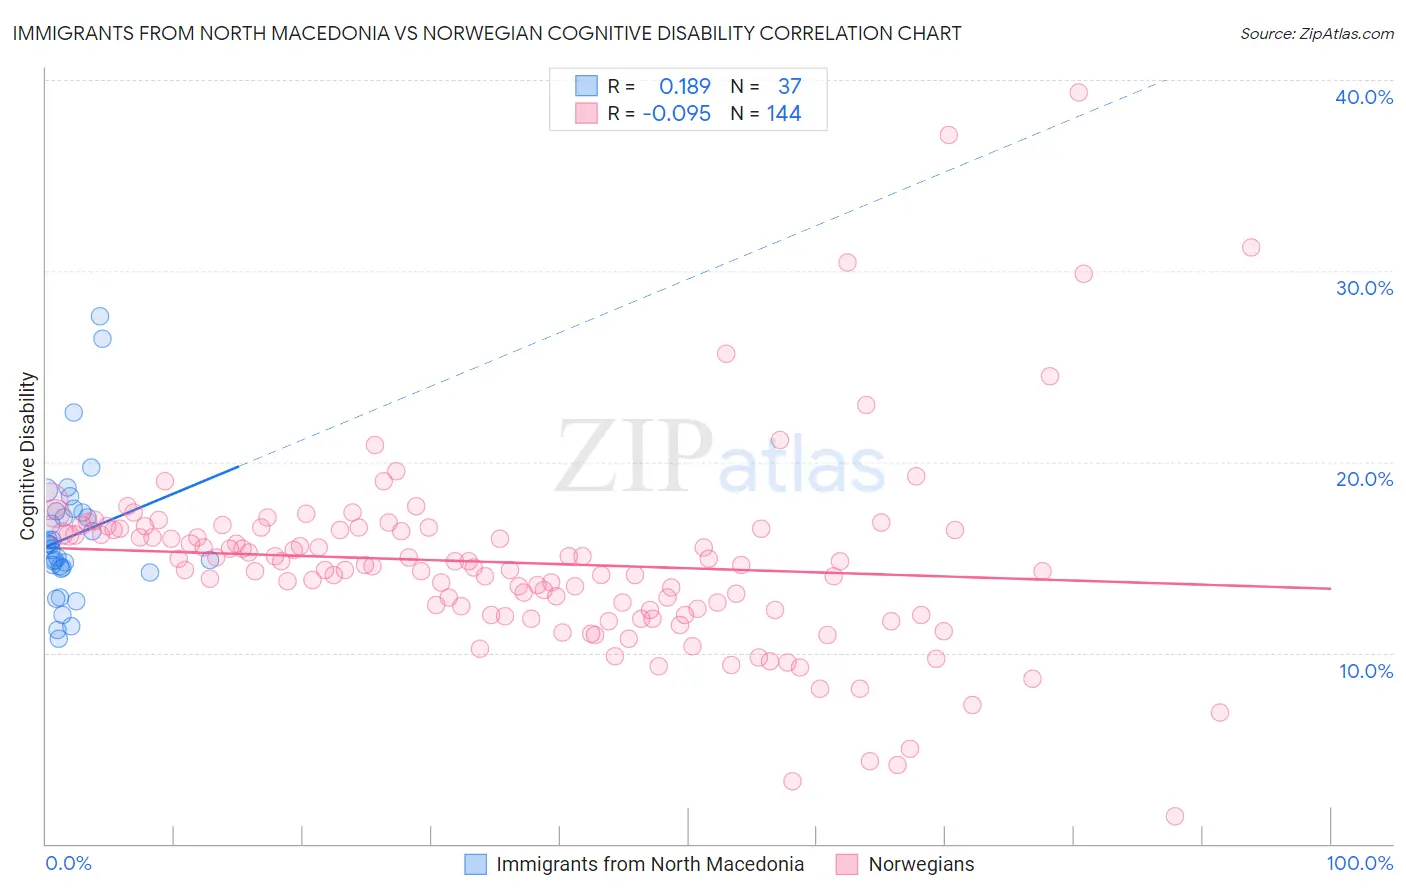
Immigrants from North Macedonia vs Norwegian Cognitive Disability Correlation Chart
The statistical analysis conducted on geographies consisting of 74,300,435 people shows a poor positive correlation between the proportion of Immigrants from North Macedonia and percentage of population with cognitive disability in the United States with a correlation coefficient (R) of 0.189 and weighted average of 16.3%. Similarly, the statistical analysis conducted on geographies consisting of 533,251,641 people shows a slight negative correlation between the proportion of Norwegians and percentage of population with cognitive disability in the United States with a correlation coefficient (R) of -0.095 and weighted average of 16.5%, a difference of 1.1%.
Cognitive Disability Correlation Summary
| Measurement | Immigrants from North Macedonia | Norwegian |
| Minimum | 10.7% | 1.5% |
| Maximum | 27.6% | 39.3% |
| Range | 16.9% | 37.9% |
| Mean | 16.1% | 14.7% |
| Median | 15.7% | 14.6% |
| Interquartile 25% (IQ1) | 14.4% | 12.1% |
| Interquartile 75% (IQ3) | 17.4% | 16.5% |
| Interquartile Range (IQR) | 3.0% | 4.4% |
| Standard Deviation (Sample) | 3.6% | 5.2% |
| Standard Deviation (Population) | 3.5% | 5.1% |
Similar Demographics by Cognitive Disability
Demographics Similar to Immigrants from North Macedonia by Cognitive Disability
In terms of cognitive disability, the demographic groups most similar to Immigrants from North Macedonia are Eastern European (16.3%, a difference of 0.020%), Immigrants from Northern Europe (16.3%, a difference of 0.060%), Immigrants from Bolivia (16.3%, a difference of 0.070%), Bulgarian (16.3%, a difference of 0.080%), and Immigrants from Cuba (16.3%, a difference of 0.12%).
| Demographics | Rating | Rank | Cognitive Disability |
| Immigrants | Scotland | 100.0 /100 | #10 | Exceptional 16.2% |
| Immigrants | Czechoslovakia | 100.0 /100 | #11 | Exceptional 16.2% |
| Maltese | 100.0 /100 | #12 | Exceptional 16.2% |
| Lithuanians | 100.0 /100 | #13 | Exceptional 16.3% |
| Immigrants | Austria | 100.0 /100 | #14 | Exceptional 16.3% |
| Immigrants | Greece | 100.0 /100 | #15 | Exceptional 16.3% |
| Eastern Europeans | 100.0 /100 | #16 | Exceptional 16.3% |
| Immigrants | North Macedonia | 100.0 /100 | #17 | Exceptional 16.3% |
| Immigrants | Northern Europe | 100.0 /100 | #18 | Exceptional 16.3% |
| Immigrants | Bolivia | 100.0 /100 | #19 | Exceptional 16.3% |
| Bulgarians | 100.0 /100 | #20 | Exceptional 16.3% |
| Immigrants | Cuba | 100.0 /100 | #21 | Exceptional 16.3% |
| Immigrants | South Central Asia | 99.9 /100 | #22 | Exceptional 16.4% |
| Croatians | 99.9 /100 | #23 | Exceptional 16.4% |
| Immigrants | Argentina | 99.9 /100 | #24 | Exceptional 16.4% |
Demographics Similar to Norwegians by Cognitive Disability
In terms of cognitive disability, the demographic groups most similar to Norwegians are Iranian (16.5%, a difference of 0.010%), Immigrants from Italy (16.5%, a difference of 0.050%), Immigrants from North America (16.5%, a difference of 0.050%), Immigrants from Korea (16.5%, a difference of 0.050%), and Immigrants from Colombia (16.5%, a difference of 0.080%).
| Demographics | Rating | Rank | Cognitive Disability |
| Immigrants | Canada | 99.8 /100 | #43 | Exceptional 16.5% |
| Macedonians | 99.8 /100 | #44 | Exceptional 16.5% |
| Immigrants | Europe | 99.8 /100 | #45 | Exceptional 16.5% |
| Immigrants | Colombia | 99.8 /100 | #46 | Exceptional 16.5% |
| Immigrants | Italy | 99.8 /100 | #47 | Exceptional 16.5% |
| Immigrants | North America | 99.8 /100 | #48 | Exceptional 16.5% |
| Iranians | 99.8 /100 | #49 | Exceptional 16.5% |
| Norwegians | 99.8 /100 | #50 | Exceptional 16.5% |
| Immigrants | Korea | 99.8 /100 | #51 | Exceptional 16.5% |
| Soviet Union | 99.8 /100 | #52 | Exceptional 16.5% |
| Swedes | 99.8 /100 | #53 | Exceptional 16.5% |
| Immigrants | Iran | 99.8 /100 | #54 | Exceptional 16.5% |
| Immigrants | Venezuela | 99.7 /100 | #55 | Exceptional 16.5% |
| Austrians | 99.7 /100 | #56 | Exceptional 16.6% |
| Bhutanese | 99.7 /100 | #57 | Exceptional 16.6% |