Immigrants from Nigeria vs Alaska Native Householder Income Ages 45 - 64 years
COMPARE
Immigrants from Nigeria
Alaska Native
Householder Income Ages 45 - 64 years
Householder Income Ages 45 - 64 years Comparison
Immigrants from Nigeria
Alaska Natives
$94,804
HOUSEHOLDER INCOME AGES 45 - 64 YEARS
5.9/ 100
METRIC RATING
221st/ 347
METRIC RANK
$93,991
HOUSEHOLDER INCOME AGES 45 - 64 YEARS
4.0/ 100
METRIC RATING
227th/ 347
METRIC RANK
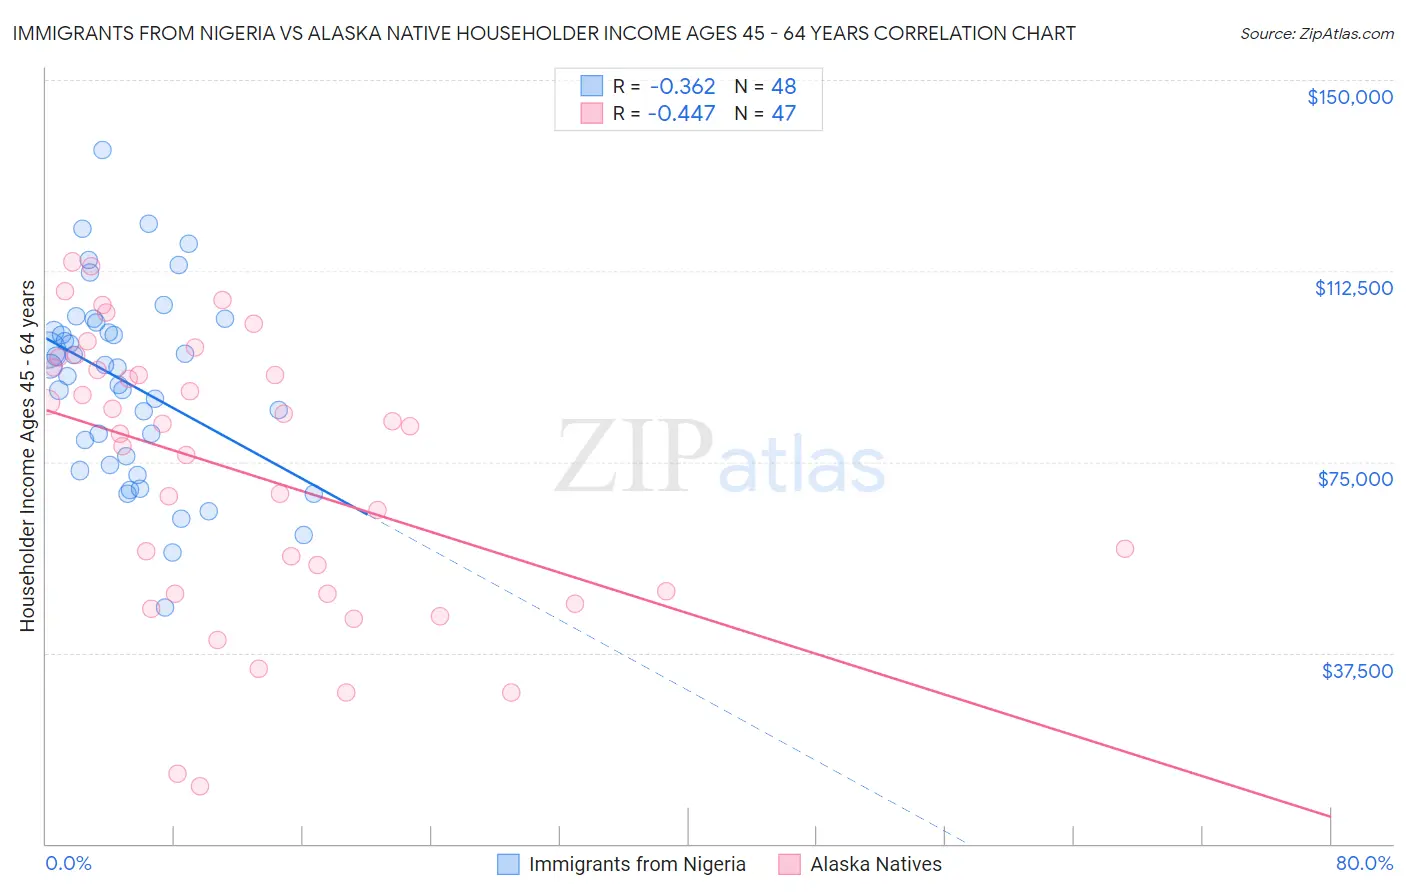
Immigrants from Nigeria vs Alaska Native Householder Income Ages 45 - 64 years Correlation Chart
The statistical analysis conducted on geographies consisting of 283,069,423 people shows a mild negative correlation between the proportion of Immigrants from Nigeria and household income with householder between the ages 45 and 64 in the United States with a correlation coefficient (R) of -0.362 and weighted average of $94,804. Similarly, the statistical analysis conducted on geographies consisting of 76,694,655 people shows a moderate negative correlation between the proportion of Alaska Natives and household income with householder between the ages 45 and 64 in the United States with a correlation coefficient (R) of -0.447 and weighted average of $93,991, a difference of 0.87%.
Householder Income Ages 45 - 64 years Correlation Summary
| Measurement | Immigrants from Nigeria | Alaska Native |
| Minimum | $46,429 | $11,250 |
| Maximum | $136,191 | $114,284 |
| Range | $89,762 | $103,034 |
| Mean | $90,499 | $73,165 |
| Median | $93,669 | $81,875 |
| Interquartile 25% (IQ1) | $75,303 | $49,167 |
| Interquartile 75% (IQ3) | $101,492 | $93,652 |
| Interquartile Range (IQR) | $26,189 | $44,485 |
| Standard Deviation (Sample) | $18,699 | $27,050 |
| Standard Deviation (Population) | $18,504 | $26,761 |
Demographics Similar to Immigrants from Nigeria and Alaska Natives by Householder Income Ages 45 - 64 years
In terms of householder income ages 45 - 64 years, the demographic groups most similar to Immigrants from Nigeria are Salvadoran ($94,842, a difference of 0.040%), Immigrants from Armenia ($94,863, a difference of 0.060%), Delaware ($94,914, a difference of 0.12%), Immigrants from Ghana ($94,982, a difference of 0.19%), and Malaysian ($94,517, a difference of 0.30%). Similarly, the demographic groups most similar to Alaska Natives are Immigrants from the Azores ($94,138, a difference of 0.16%), Immigrants from Panama ($93,815, a difference of 0.19%), Bermudan ($94,197, a difference of 0.22%), Vietnamese ($93,788, a difference of 0.22%), and Immigrants from Sudan ($93,781, a difference of 0.22%).
| Demographics | Rating | Rank | Householder Income Ages 45 - 64 years |
| Panamanians | 10.6 /100 | #214 | Poor $96,066 |
| Nigerians | 8.2 /100 | #215 | Tragic $95,492 |
| Immigrants | Venezuela | 7.6 /100 | #216 | Tragic $95,342 |
| Immigrants | Ghana | 6.4 /100 | #217 | Tragic $94,982 |
| Delaware | 6.2 /100 | #218 | Tragic $94,914 |
| Immigrants | Armenia | 6.1 /100 | #219 | Tragic $94,863 |
| Salvadorans | 6.0 /100 | #220 | Tragic $94,842 |
| Immigrants | Nigeria | 5.9 /100 | #221 | Tragic $94,804 |
| Malaysians | 5.2 /100 | #222 | Tragic $94,517 |
| Immigrants | Nonimmigrants | 5.0 /100 | #223 | Tragic $94,448 |
| Immigrants | Bosnia and Herzegovina | 4.6 /100 | #224 | Tragic $94,288 |
| Bermudans | 4.4 /100 | #225 | Tragic $94,197 |
| Immigrants | Azores | 4.3 /100 | #226 | Tragic $94,138 |
| Alaska Natives | 4.0 /100 | #227 | Tragic $93,991 |
| Immigrants | Panama | 3.7 /100 | #228 | Tragic $93,815 |
| Vietnamese | 3.6 /100 | #229 | Tragic $93,788 |
| Immigrants | Sudan | 3.6 /100 | #230 | Tragic $93,781 |
| Ecuadorians | 3.6 /100 | #231 | Tragic $93,739 |
| Sudanese | 3.5 /100 | #232 | Tragic $93,718 |
| Nepalese | 3.0 /100 | #233 | Tragic $93,355 |
| Immigrants | El Salvador | 2.7 /100 | #234 | Tragic $93,176 |