Immigrants from Nigeria vs Salvadoran Householder Income Ages 45 - 64 years
COMPARE
Immigrants from Nigeria
Salvadoran
Householder Income Ages 45 - 64 years
Householder Income Ages 45 - 64 years Comparison
Immigrants from Nigeria
Salvadorans
$94,804
HOUSEHOLDER INCOME AGES 45 - 64 YEARS
5.9/ 100
METRIC RATING
221st/ 347
METRIC RANK
$94,842
HOUSEHOLDER INCOME AGES 45 - 64 YEARS
6.0/ 100
METRIC RATING
220th/ 347
METRIC RANK
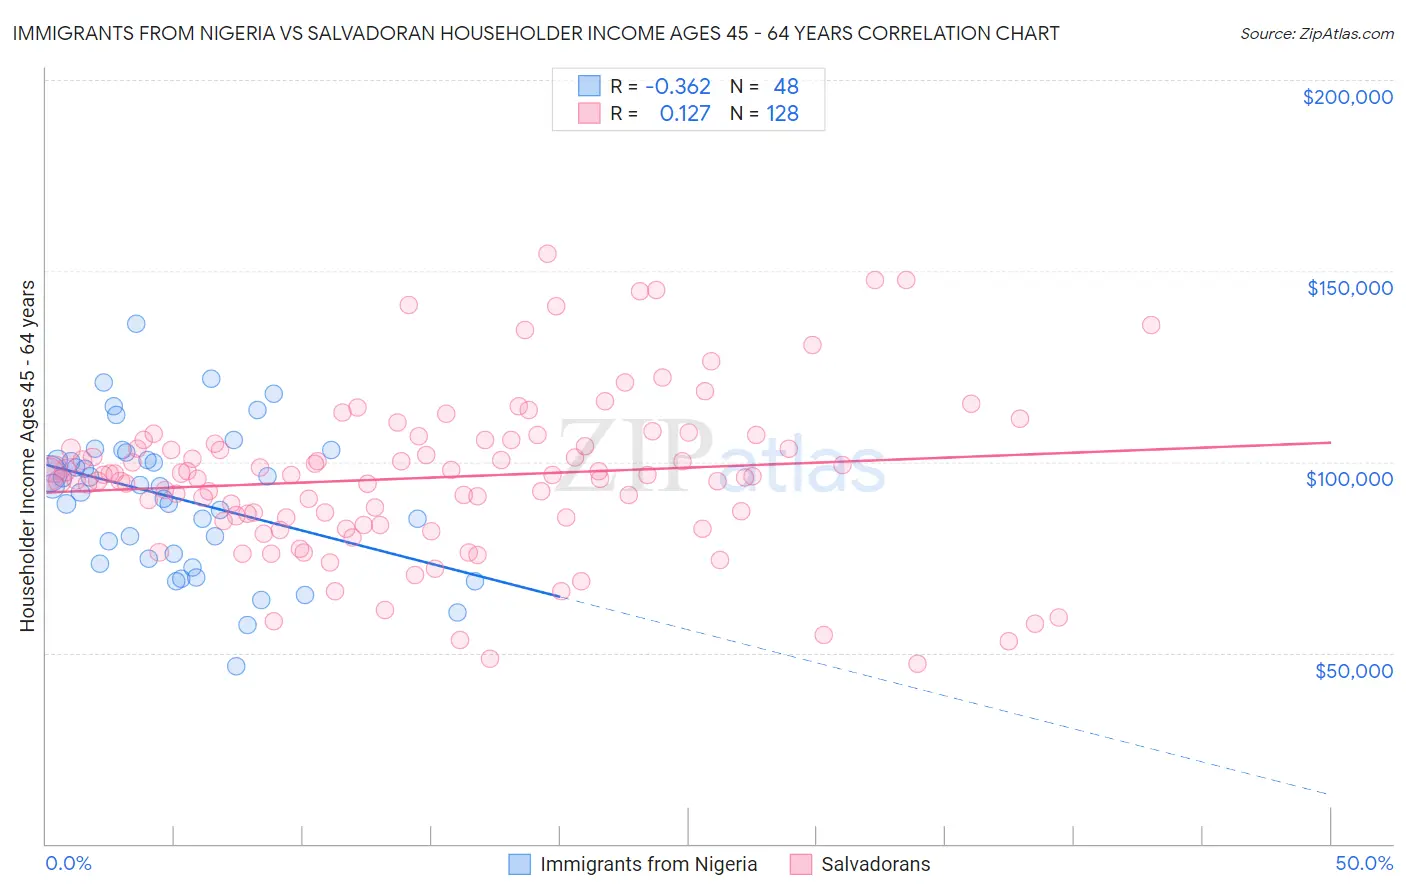
Immigrants from Nigeria vs Salvadoran Householder Income Ages 45 - 64 years Correlation Chart
The statistical analysis conducted on geographies consisting of 283,069,423 people shows a mild negative correlation between the proportion of Immigrants from Nigeria and household income with householder between the ages 45 and 64 in the United States with a correlation coefficient (R) of -0.362 and weighted average of $94,804. Similarly, the statistical analysis conducted on geographies consisting of 398,191,339 people shows a poor positive correlation between the proportion of Salvadorans and household income with householder between the ages 45 and 64 in the United States with a correlation coefficient (R) of 0.127 and weighted average of $94,842, a difference of 0.040%.
Householder Income Ages 45 - 64 years Correlation Summary
| Measurement | Immigrants from Nigeria | Salvadoran |
| Minimum | $46,429 | $47,083 |
| Maximum | $136,191 | $154,565 |
| Range | $89,762 | $107,482 |
| Mean | $90,499 | $95,925 |
| Median | $93,669 | $96,593 |
| Interquartile 25% (IQ1) | $75,303 | $84,940 |
| Interquartile 75% (IQ3) | $101,492 | $105,324 |
| Interquartile Range (IQR) | $26,189 | $20,384 |
| Standard Deviation (Sample) | $18,699 | $20,754 |
| Standard Deviation (Population) | $18,504 | $20,673 |
Demographics Similar to Immigrants from Nigeria and Salvadorans by Householder Income Ages 45 - 64 years
In terms of householder income ages 45 - 64 years, the demographic groups most similar to Immigrants from Nigeria are Immigrants from Armenia ($94,863, a difference of 0.060%), Delaware ($94,914, a difference of 0.12%), Immigrants from Ghana ($94,982, a difference of 0.19%), Malaysian ($94,517, a difference of 0.30%), and Nonimmigrants ($94,448, a difference of 0.38%). Similarly, the demographic groups most similar to Salvadorans are Immigrants from Armenia ($94,863, a difference of 0.020%), Delaware ($94,914, a difference of 0.080%), Immigrants from Ghana ($94,982, a difference of 0.15%), Malaysian ($94,517, a difference of 0.34%), and Nonimmigrants ($94,448, a difference of 0.42%).
| Demographics | Rating | Rank | Householder Income Ages 45 - 64 years |
| Tsimshian | 14.5 /100 | #210 | Poor $96,783 |
| Immigrants | Cambodia | 13.0 /100 | #211 | Poor $96,537 |
| Venezuelans | 12.6 /100 | #212 | Poor $96,460 |
| Immigrants | Uruguay | 10.7 /100 | #213 | Poor $96,086 |
| Panamanians | 10.6 /100 | #214 | Poor $96,066 |
| Nigerians | 8.2 /100 | #215 | Tragic $95,492 |
| Immigrants | Venezuela | 7.6 /100 | #216 | Tragic $95,342 |
| Immigrants | Ghana | 6.4 /100 | #217 | Tragic $94,982 |
| Delaware | 6.2 /100 | #218 | Tragic $94,914 |
| Immigrants | Armenia | 6.1 /100 | #219 | Tragic $94,863 |
| Salvadorans | 6.0 /100 | #220 | Tragic $94,842 |
| Immigrants | Nigeria | 5.9 /100 | #221 | Tragic $94,804 |
| Malaysians | 5.2 /100 | #222 | Tragic $94,517 |
| Immigrants | Nonimmigrants | 5.0 /100 | #223 | Tragic $94,448 |
| Immigrants | Bosnia and Herzegovina | 4.6 /100 | #224 | Tragic $94,288 |
| Bermudans | 4.4 /100 | #225 | Tragic $94,197 |
| Immigrants | Azores | 4.3 /100 | #226 | Tragic $94,138 |
| Alaska Natives | 4.0 /100 | #227 | Tragic $93,991 |
| Immigrants | Panama | 3.7 /100 | #228 | Tragic $93,815 |
| Vietnamese | 3.6 /100 | #229 | Tragic $93,788 |
| Immigrants | Sudan | 3.6 /100 | #230 | Tragic $93,781 |