Immigrants from Nicaragua vs Immigrants from Mexico Married-couple Households
COMPARE
Immigrants from Nicaragua
Immigrants from Mexico
Married-couple Households
Married-couple Households Comparison
Immigrants from Nicaragua
Immigrants from Mexico
44.5%
MARRIED-COUPLE HOUSEHOLDS
1.2/ 100
METRIC RATING
235th/ 347
METRIC RANK
46.4%
MARRIED-COUPLE HOUSEHOLDS
50.0/ 100
METRIC RATING
174th/ 347
METRIC RANK
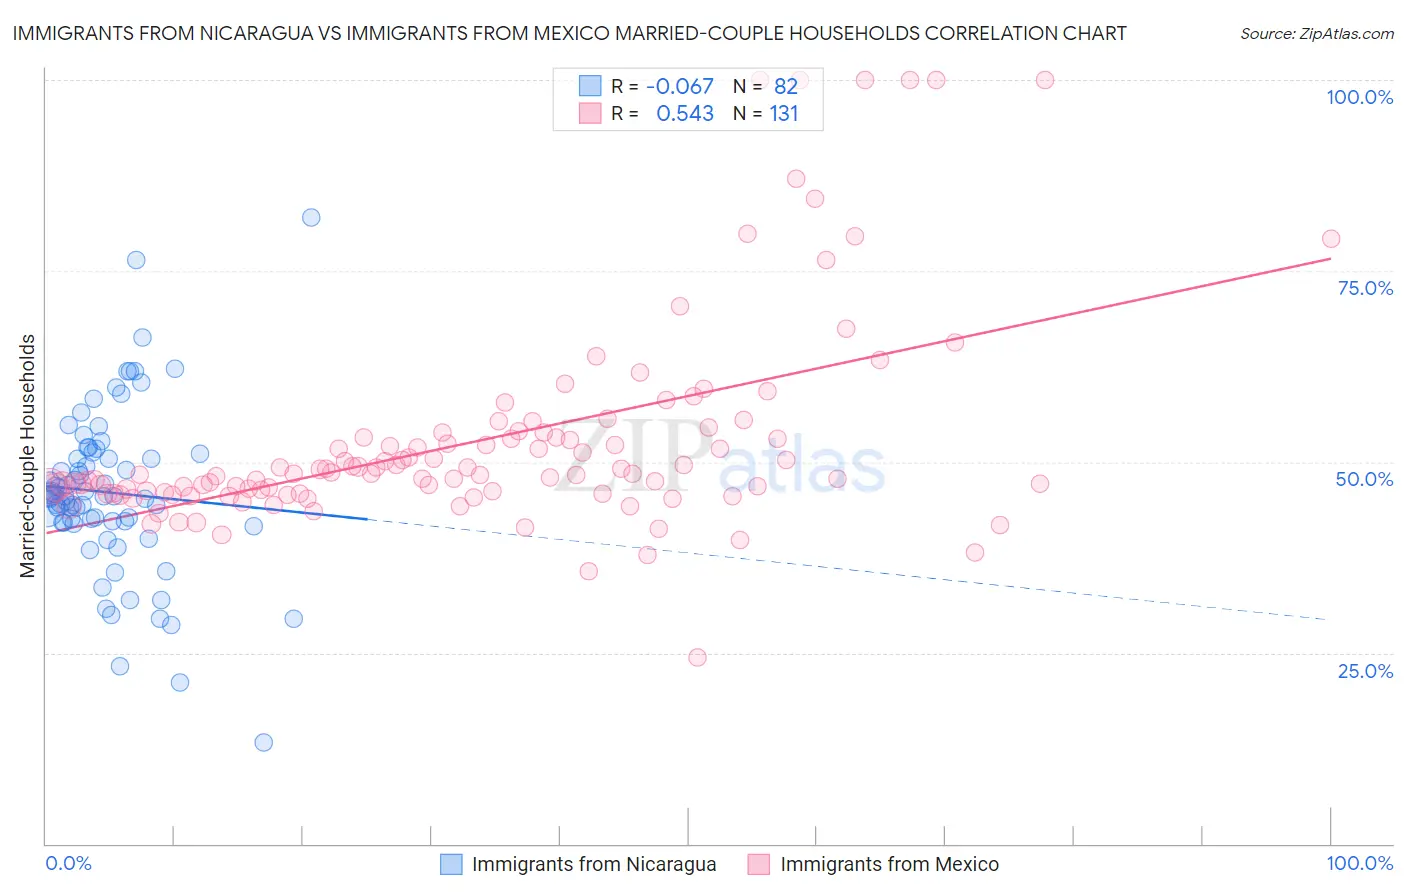
Immigrants from Nicaragua vs Immigrants from Mexico Married-couple Households Correlation Chart
The statistical analysis conducted on geographies consisting of 236,322,720 people shows a slight negative correlation between the proportion of Immigrants from Nicaragua and percentage of married-couple family households in the United States with a correlation coefficient (R) of -0.067 and weighted average of 44.5%. Similarly, the statistical analysis conducted on geographies consisting of 513,378,899 people shows a substantial positive correlation between the proportion of Immigrants from Mexico and percentage of married-couple family households in the United States with a correlation coefficient (R) of 0.543 and weighted average of 46.4%, a difference of 4.3%.
Married-couple Households Correlation Summary
| Measurement | Immigrants from Nicaragua | Immigrants from Mexico |
| Minimum | 13.2% | 24.4% |
| Maximum | 82.0% | 100.0% |
| Range | 68.8% | 75.6% |
| Mean | 46.0% | 52.8% |
| Median | 45.5% | 48.4% |
| Interquartile 25% (IQ1) | 42.1% | 45.9% |
| Interquartile 75% (IQ3) | 51.0% | 53.3% |
| Interquartile Range (IQR) | 9.0% | 7.4% |
| Standard Deviation (Sample) | 10.9% | 13.8% |
| Standard Deviation (Population) | 10.9% | 13.7% |
Similar Demographics by Married-couple Households
Demographics Similar to Immigrants from Nicaragua by Married-couple Households
In terms of married-couple households, the demographic groups most similar to Immigrants from Nicaragua are Yaqui (44.5%, a difference of 0.0%), Comanche (44.5%, a difference of 0.040%), Immigrants from Panama (44.6%, a difference of 0.070%), Immigrants from Uruguay (44.5%, a difference of 0.090%), and Spanish American (44.5%, a difference of 0.10%).
| Demographics | Rating | Rank | Married-couple Households |
| Kenyans | 1.7 /100 | #228 | Tragic 44.7% |
| Immigrants | Latin America | 1.6 /100 | #229 | Tragic 44.7% |
| Soviet Union | 1.6 /100 | #230 | Tragic 44.6% |
| Houma | 1.5 /100 | #231 | Tragic 44.6% |
| Marshallese | 1.5 /100 | #232 | Tragic 44.6% |
| Immigrants | Uganda | 1.5 /100 | #233 | Tragic 44.6% |
| Immigrants | Panama | 1.3 /100 | #234 | Tragic 44.6% |
| Immigrants | Nicaragua | 1.2 /100 | #235 | Tragic 44.5% |
| Yaqui | 1.2 /100 | #236 | Tragic 44.5% |
| Comanche | 1.2 /100 | #237 | Tragic 44.5% |
| Immigrants | Uruguay | 1.1 /100 | #238 | Tragic 44.5% |
| Spanish Americans | 1.1 /100 | #239 | Tragic 44.5% |
| Ute | 1.0 /100 | #240 | Tragic 44.4% |
| Immigrants | Bosnia and Herzegovina | 1.0 /100 | #241 | Tragic 44.4% |
| Immigrants | Albania | 1.0 /100 | #242 | Tragic 44.4% |
Demographics Similar to Immigrants from Mexico by Married-couple Households
In terms of married-couple households, the demographic groups most similar to Immigrants from Mexico are Immigrants from Norway (46.5%, a difference of 0.070%), Immigrants from Colombia (46.4%, a difference of 0.15%), Immigrants from Australia (46.5%, a difference of 0.17%), Cajun (46.4%, a difference of 0.18%), and Immigrants from Chile (46.5%, a difference of 0.22%).
| Demographics | Rating | Rank | Married-couple Households |
| Immigrants | Croatia | 64.2 /100 | #167 | Good 46.7% |
| Israelis | 62.3 /100 | #168 | Good 46.7% |
| Spanish American Indians | 59.4 /100 | #169 | Average 46.6% |
| South Americans | 58.0 /100 | #170 | Average 46.6% |
| Immigrants | Chile | 55.7 /100 | #171 | Average 46.5% |
| Immigrants | Australia | 54.6 /100 | #172 | Average 46.5% |
| Immigrants | Norway | 52.0 /100 | #173 | Average 46.5% |
| Immigrants | Mexico | 50.0 /100 | #174 | Average 46.4% |
| Immigrants | Colombia | 46.1 /100 | #175 | Average 46.4% |
| Cajuns | 45.2 /100 | #176 | Average 46.4% |
| Immigrants | Immigrants | 43.8 /100 | #177 | Average 46.3% |
| Immigrants | Costa Rica | 43.4 /100 | #178 | Average 46.3% |
| Immigrants | Zimbabwe | 43.0 /100 | #179 | Average 46.3% |
| Mongolians | 42.0 /100 | #180 | Average 46.3% |
| Malaysians | 41.8 /100 | #181 | Average 46.3% |