Immigrants from Nicaragua vs Immigrants from Mexico In Labor Force | Age 20-24
COMPARE
Immigrants from Nicaragua
Immigrants from Mexico
In Labor Force | Age 20-24
In Labor Force | Age 20-24 Comparison
Immigrants from Nicaragua
Immigrants from Mexico
72.9%
IN LABOR FORCE | AGE 20-24
0.0/ 100
METRIC RATING
291st/ 347
METRIC RANK
75.0%
IN LABOR FORCE | AGE 20-24
47.8/ 100
METRIC RATING
177th/ 347
METRIC RANK
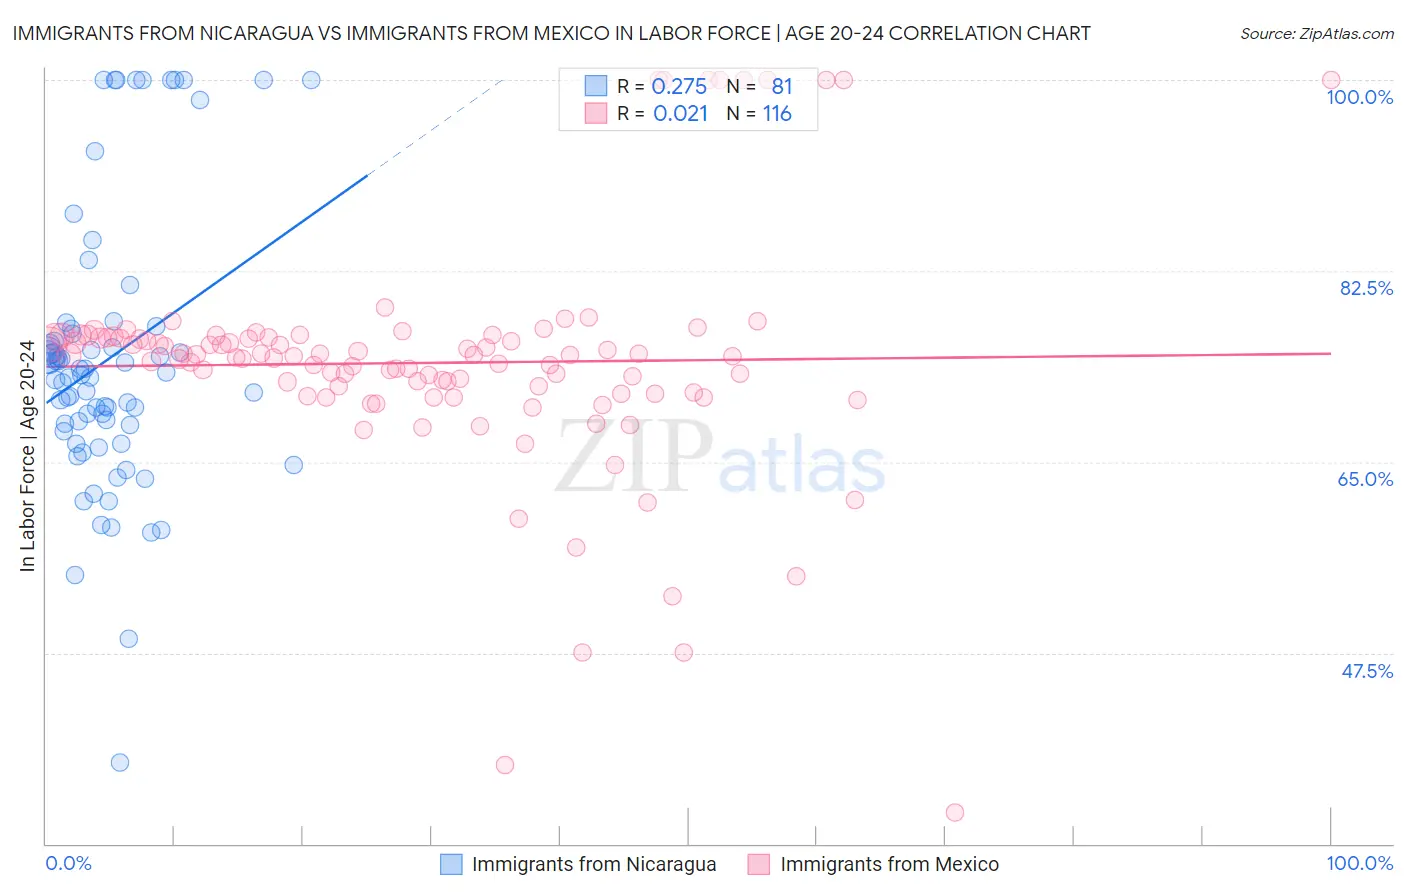
Immigrants from Nicaragua vs Immigrants from Mexico In Labor Force | Age 20-24 Correlation Chart
The statistical analysis conducted on geographies consisting of 236,317,721 people shows a weak positive correlation between the proportion of Immigrants from Nicaragua and labor force participation rate among population between the ages 20 and 24 in the United States with a correlation coefficient (R) of 0.275 and weighted average of 72.9%. Similarly, the statistical analysis conducted on geographies consisting of 513,104,206 people shows no correlation between the proportion of Immigrants from Mexico and labor force participation rate among population between the ages 20 and 24 in the United States with a correlation coefficient (R) of 0.021 and weighted average of 75.0%, a difference of 2.9%.
In Labor Force | Age 20-24 Correlation Summary
| Measurement | Immigrants from Nicaragua | Immigrants from Mexico |
| Minimum | 37.5% | 32.9% |
| Maximum | 100.0% | 100.0% |
| Range | 62.5% | 67.1% |
| Mean | 74.5% | 74.1% |
| Median | 73.0% | 74.7% |
| Interquartile 25% (IQ1) | 68.1% | 71.3% |
| Interquartile 75% (IQ3) | 76.9% | 76.4% |
| Interquartile Range (IQR) | 8.8% | 5.1% |
| Standard Deviation (Sample) | 12.7% | 10.6% |
| Standard Deviation (Population) | 12.7% | 10.6% |
Similar Demographics by In Labor Force | Age 20-24
Demographics Similar to Immigrants from Nicaragua by In Labor Force | Age 20-24
In terms of in labor force | age 20-24, the demographic groups most similar to Immigrants from Nicaragua are Immigrants from Belarus (73.0%, a difference of 0.080%), Pueblo (72.9%, a difference of 0.090%), U.S. Virgin Islander (73.0%, a difference of 0.15%), Immigrants from Belize (72.8%, a difference of 0.15%), and Argentinean (73.1%, a difference of 0.18%).
| Demographics | Rating | Rank | In Labor Force | Age 20-24 |
| Kiowa | 0.1 /100 | #284 | Tragic 73.2% |
| Nicaraguans | 0.1 /100 | #285 | Tragic 73.2% |
| Immigrants | Lebanon | 0.1 /100 | #286 | Tragic 73.1% |
| Immigrants | Korea | 0.1 /100 | #287 | Tragic 73.1% |
| Argentineans | 0.1 /100 | #288 | Tragic 73.1% |
| U.S. Virgin Islanders | 0.1 /100 | #289 | Tragic 73.0% |
| Immigrants | Belarus | 0.1 /100 | #290 | Tragic 73.0% |
| Immigrants | Nicaragua | 0.0 /100 | #291 | Tragic 72.9% |
| Pueblo | 0.0 /100 | #292 | Tragic 72.9% |
| Immigrants | Belize | 0.0 /100 | #293 | Tragic 72.8% |
| Immigrants | Argentina | 0.0 /100 | #294 | Tragic 72.8% |
| Okinawans | 0.0 /100 | #295 | Tragic 72.7% |
| Jamaicans | 0.0 /100 | #296 | Tragic 72.7% |
| Central American Indians | 0.0 /100 | #297 | Tragic 72.7% |
| Israelis | 0.0 /100 | #298 | Tragic 72.6% |
Demographics Similar to Immigrants from Mexico by In Labor Force | Age 20-24
In terms of in labor force | age 20-24, the demographic groups most similar to Immigrants from Mexico are Central American (75.0%, a difference of 0.010%), Syrian (75.0%, a difference of 0.020%), Immigrants from Croatia (75.1%, a difference of 0.030%), South African (75.0%, a difference of 0.030%), and Yakama (75.1%, a difference of 0.040%).
| Demographics | Rating | Rank | In Labor Force | Age 20-24 |
| Mexicans | 52.1 /100 | #170 | Average 75.1% |
| Cajuns | 51.1 /100 | #171 | Average 75.1% |
| Yakama | 50.8 /100 | #172 | Average 75.1% |
| Immigrants | Croatia | 50.2 /100 | #173 | Average 75.1% |
| South Africans | 50.0 /100 | #174 | Average 75.0% |
| Syrians | 49.5 /100 | #175 | Average 75.0% |
| Central Americans | 48.7 /100 | #176 | Average 75.0% |
| Immigrants | Mexico | 47.8 /100 | #177 | Average 75.0% |
| Immigrants | Central America | 45.0 /100 | #178 | Average 75.0% |
| Immigrants | Latvia | 44.1 /100 | #179 | Average 75.0% |
| Immigrants | Czechoslovakia | 44.0 /100 | #180 | Average 75.0% |
| Africans | 42.5 /100 | #181 | Average 75.0% |
| Immigrants | South Africa | 36.9 /100 | #182 | Fair 74.9% |
| Immigrants | Costa Rica | 36.7 /100 | #183 | Fair 74.9% |
| Immigrants | Hungary | 35.0 /100 | #184 | Fair 74.9% |