Immigrants from Nicaragua vs Cambodian Doctorate Degree
COMPARE
Immigrants from Nicaragua
Cambodian
Doctorate Degree
Doctorate Degree Comparison
Immigrants from Nicaragua
Cambodians
1.4%
DOCTORATE DEGREE
0.1/ 100
METRIC RATING
312th/ 347
METRIC RANK
2.6%
DOCTORATE DEGREE
100.0/ 100
METRIC RATING
33rd/ 347
METRIC RANK
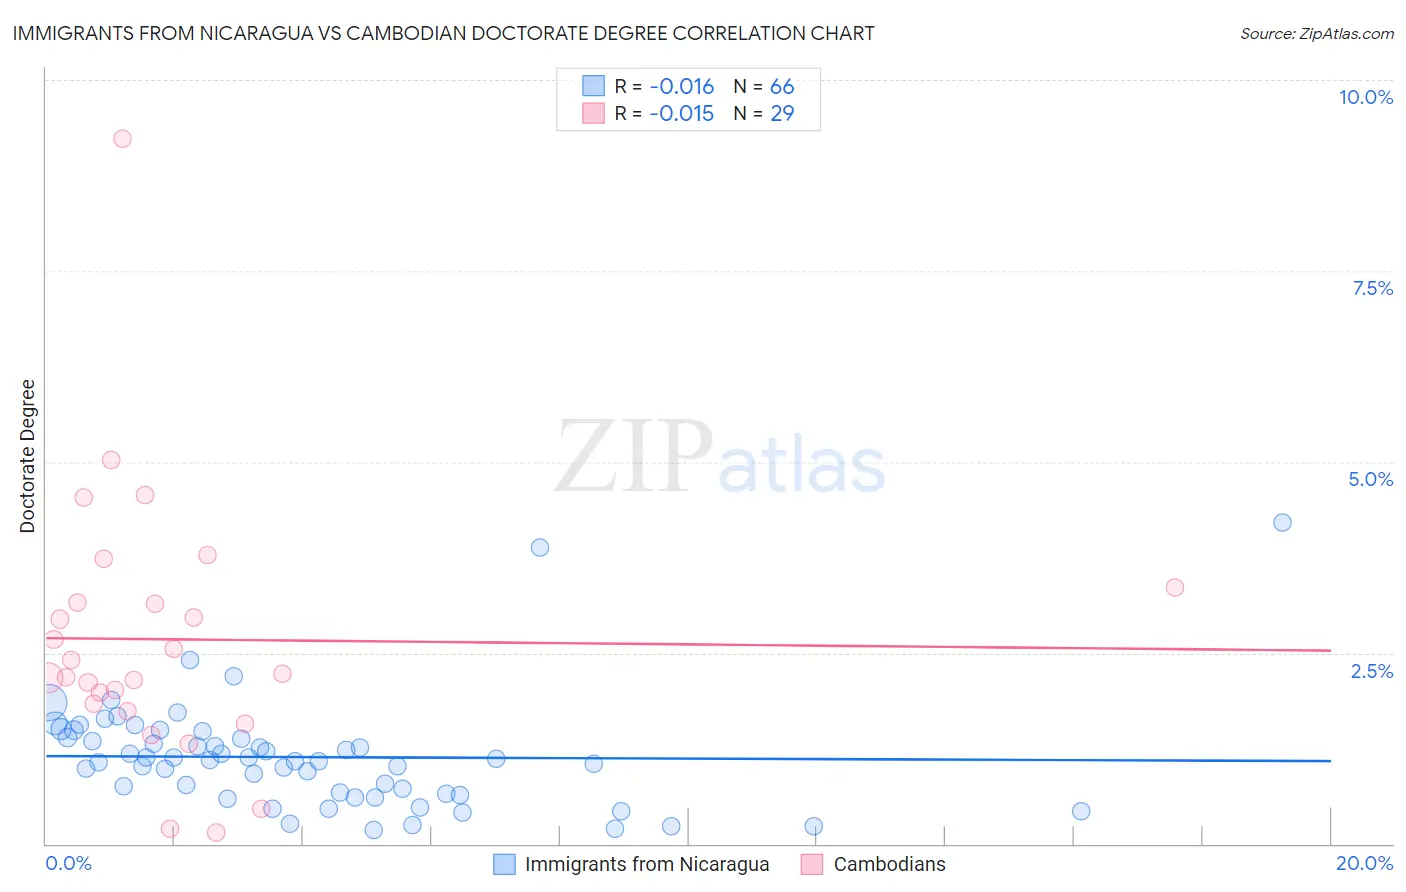
Immigrants from Nicaragua vs Cambodian Doctorate Degree Correlation Chart
The statistical analysis conducted on geographies consisting of 234,843,041 people shows no correlation between the proportion of Immigrants from Nicaragua and percentage of population with at least doctorate degree education in the United States with a correlation coefficient (R) of -0.016 and weighted average of 1.4%. Similarly, the statistical analysis conducted on geographies consisting of 102,342,908 people shows no correlation between the proportion of Cambodians and percentage of population with at least doctorate degree education in the United States with a correlation coefficient (R) of -0.015 and weighted average of 2.6%, a difference of 89.0%.
Doctorate Degree Correlation Summary
| Measurement | Immigrants from Nicaragua | Cambodian |
| Minimum | 0.18% | 0.15% |
| Maximum | 4.2% | 9.2% |
| Range | 4.0% | 9.1% |
| Mean | 1.1% | 2.7% |
| Median | 1.1% | 2.2% |
| Interquartile 25% (IQ1) | 0.66% | 1.8% |
| Interquartile 75% (IQ3) | 1.4% | 3.3% |
| Interquartile Range (IQR) | 0.74% | 1.5% |
| Standard Deviation (Sample) | 0.71% | 1.7% |
| Standard Deviation (Population) | 0.71% | 1.7% |
Similar Demographics by Doctorate Degree
Demographics Similar to Immigrants from Nicaragua by Doctorate Degree
In terms of doctorate degree, the demographic groups most similar to Immigrants from Nicaragua are Menominee (1.4%, a difference of 0.32%), Immigrants from Honduras (1.4%, a difference of 0.38%), Dominican (1.4%, a difference of 0.39%), Immigrants from the Azores (1.4%, a difference of 0.42%), and Immigrants from Jamaica (1.4%, a difference of 0.55%).
| Demographics | Rating | Rank | Doctorate Degree |
| Pennsylvania Germans | 0.1 /100 | #305 | Tragic 1.4% |
| Guyanese | 0.1 /100 | #306 | Tragic 1.4% |
| Cubans | 0.1 /100 | #307 | Tragic 1.4% |
| Immigrants | Laos | 0.1 /100 | #308 | Tragic 1.4% |
| Immigrants | Grenada | 0.1 /100 | #309 | Tragic 1.4% |
| Immigrants | Jamaica | 0.1 /100 | #310 | Tragic 1.4% |
| Immigrants | Honduras | 0.1 /100 | #311 | Tragic 1.4% |
| Immigrants | Nicaragua | 0.1 /100 | #312 | Tragic 1.4% |
| Menominee | 0.1 /100 | #313 | Tragic 1.4% |
| Dominicans | 0.1 /100 | #314 | Tragic 1.4% |
| Immigrants | Azores | 0.1 /100 | #315 | Tragic 1.4% |
| Navajo | 0.1 /100 | #316 | Tragic 1.4% |
| Immigrants | Micronesia | 0.1 /100 | #317 | Tragic 1.3% |
| Creek | 0.1 /100 | #318 | Tragic 1.3% |
| Immigrants | Guyana | 0.1 /100 | #319 | Tragic 1.3% |
Demographics Similar to Cambodians by Doctorate Degree
In terms of doctorate degree, the demographic groups most similar to Cambodians are Cypriot (2.6%, a difference of 0.11%), Immigrants from Northern Europe (2.6%, a difference of 0.17%), Immigrants from Malaysia (2.6%, a difference of 0.17%), Immigrants from Spain (2.6%, a difference of 0.23%), and Latvian (2.6%, a difference of 0.33%).
| Demographics | Rating | Rank | Doctorate Degree |
| Turks | 100.0 /100 | #26 | Exceptional 2.7% |
| Immigrants | Turkey | 100.0 /100 | #27 | Exceptional 2.6% |
| Burmese | 100.0 /100 | #28 | Exceptional 2.6% |
| Immigrants | South Central Asia | 100.0 /100 | #29 | Exceptional 2.6% |
| Immigrants | Korea | 100.0 /100 | #30 | Exceptional 2.6% |
| Latvians | 100.0 /100 | #31 | Exceptional 2.6% |
| Immigrants | Northern Europe | 100.0 /100 | #32 | Exceptional 2.6% |
| Cambodians | 100.0 /100 | #33 | Exceptional 2.6% |
| Cypriots | 100.0 /100 | #34 | Exceptional 2.6% |
| Immigrants | Malaysia | 100.0 /100 | #35 | Exceptional 2.6% |
| Immigrants | Spain | 100.0 /100 | #36 | Exceptional 2.6% |
| Immigrants | Kuwait | 100.0 /100 | #37 | Exceptional 2.6% |
| Russians | 100.0 /100 | #38 | Exceptional 2.6% |
| Immigrants | Ireland | 100.0 /100 | #39 | Exceptional 2.5% |
| Estonians | 100.0 /100 | #40 | Exceptional 2.5% |