Immigrants from Nepal vs Cambodian Householder Income Ages 45 - 64 years
COMPARE
Immigrants from Nepal
Cambodian
Householder Income Ages 45 - 64 years
Householder Income Ages 45 - 64 years Comparison
Immigrants from Nepal
Cambodians
$102,190
HOUSEHOLDER INCOME AGES 45 - 64 YEARS
71.8/ 100
METRIC RATING
161st/ 347
METRIC RANK
$114,342
HOUSEHOLDER INCOME AGES 45 - 64 YEARS
99.9/ 100
METRIC RATING
40th/ 347
METRIC RANK
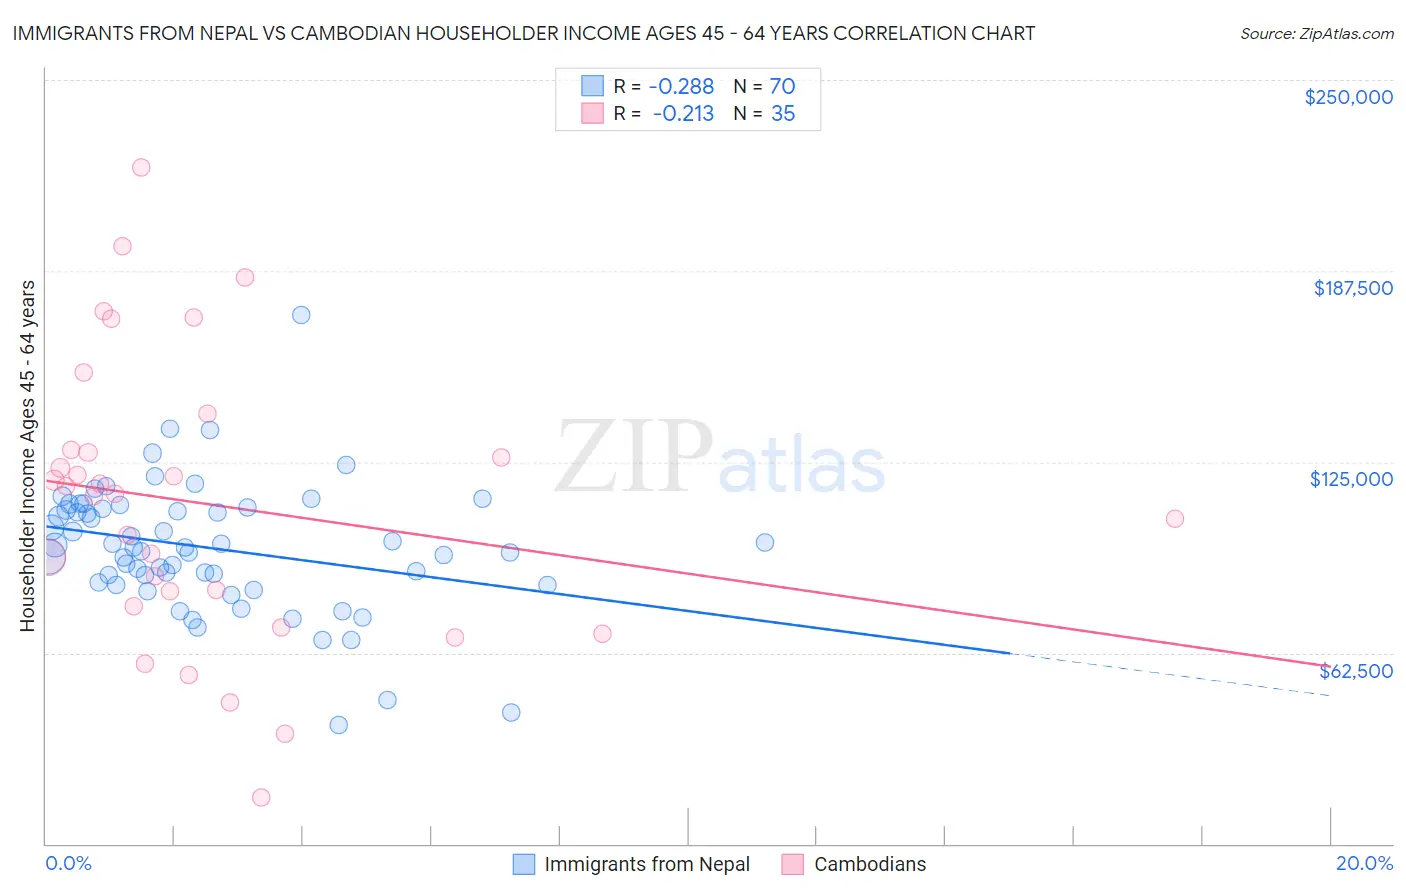
Immigrants from Nepal vs Cambodian Householder Income Ages 45 - 64 years Correlation Chart
The statistical analysis conducted on geographies consisting of 186,605,051 people shows a weak negative correlation between the proportion of Immigrants from Nepal and household income with householder between the ages 45 and 64 in the United States with a correlation coefficient (R) of -0.288 and weighted average of $102,190. Similarly, the statistical analysis conducted on geographies consisting of 102,430,914 people shows a weak negative correlation between the proportion of Cambodians and household income with householder between the ages 45 and 64 in the United States with a correlation coefficient (R) of -0.213 and weighted average of $114,342, a difference of 11.9%.
Householder Income Ages 45 - 64 years Correlation Summary
| Measurement | Immigrants from Nepal | Cambodian |
| Minimum | $38,929 | $15,079 |
| Maximum | $173,233 | $221,500 |
| Range | $134,304 | $206,421 |
| Mean | $96,757 | $111,198 |
| Median | $96,927 | $114,622 |
| Interquartile 25% (IQ1) | $85,480 | $77,671 |
| Interquartile 75% (IQ3) | $109,661 | $128,994 |
| Interquartile Range (IQR) | $24,181 | $51,323 |
| Standard Deviation (Sample) | $21,222 | $46,823 |
| Standard Deviation (Population) | $21,070 | $46,149 |
Similar Demographics by Householder Income Ages 45 - 64 years
Demographics Similar to Immigrants from Nepal by Householder Income Ages 45 - 64 years
In terms of householder income ages 45 - 64 years, the demographic groups most similar to Immigrants from Nepal are Icelander ($102,261, a difference of 0.070%), Scottish ($102,123, a difference of 0.070%), English ($102,021, a difference of 0.17%), Immigrants from Morocco ($102,015, a difference of 0.17%), and Sierra Leonean ($102,427, a difference of 0.23%).
| Demographics | Rating | Rank | Householder Income Ages 45 - 64 years |
| Slovenes | 78.3 /100 | #154 | Good $102,885 |
| Costa Ricans | 77.4 /100 | #155 | Good $102,779 |
| Carpatho Rusyns | 77.4 /100 | #156 | Good $102,777 |
| Immigrants | Ethiopia | 77.3 /100 | #157 | Good $102,763 |
| Slavs | 76.1 /100 | #158 | Good $102,629 |
| Sierra Leoneans | 74.2 /100 | #159 | Good $102,427 |
| Icelanders | 72.5 /100 | #160 | Good $102,261 |
| Immigrants | Nepal | 71.8 /100 | #161 | Good $102,190 |
| Scottish | 71.1 /100 | #162 | Good $102,123 |
| English | 70.1 /100 | #163 | Good $102,021 |
| Immigrants | Morocco | 70.0 /100 | #164 | Good $102,015 |
| Immigrants | Albania | 69.4 /100 | #165 | Good $101,957 |
| Samoans | 65.3 /100 | #166 | Good $101,580 |
| Czechoslovakians | 63.0 /100 | #167 | Good $101,387 |
| South American Indians | 60.5 /100 | #168 | Good $101,171 |
Demographics Similar to Cambodians by Householder Income Ages 45 - 64 years
In terms of householder income ages 45 - 64 years, the demographic groups most similar to Cambodians are Immigrants from Lithuania ($114,336, a difference of 0.010%), Immigrants from Turkey ($114,407, a difference of 0.060%), Immigrants from Pakistan ($114,434, a difference of 0.080%), Estonian ($114,220, a difference of 0.11%), and Israeli ($114,186, a difference of 0.14%).
| Demographics | Rating | Rank | Householder Income Ages 45 - 64 years |
| Chinese | 100.0 /100 | #33 | Exceptional $116,156 |
| Immigrants | Denmark | 100.0 /100 | #34 | Exceptional $116,000 |
| Latvians | 100.0 /100 | #35 | Exceptional $115,957 |
| Immigrants | Switzerland | 100.0 /100 | #36 | Exceptional $115,934 |
| Maltese | 99.9 /100 | #37 | Exceptional $114,754 |
| Immigrants | Pakistan | 99.9 /100 | #38 | Exceptional $114,434 |
| Immigrants | Turkey | 99.9 /100 | #39 | Exceptional $114,407 |
| Cambodians | 99.9 /100 | #40 | Exceptional $114,342 |
| Immigrants | Lithuania | 99.9 /100 | #41 | Exceptional $114,336 |
| Estonians | 99.9 /100 | #42 | Exceptional $114,220 |
| Israelis | 99.9 /100 | #43 | Exceptional $114,186 |
| Bulgarians | 99.9 /100 | #44 | Exceptional $113,883 |
| Immigrants | France | 99.9 /100 | #45 | Exceptional $113,680 |
| Immigrants | Greece | 99.9 /100 | #46 | Exceptional $113,548 |
| Australians | 99.9 /100 | #47 | Exceptional $113,533 |