Immigrants from Netherlands vs Immigrants from Bahamas Householder Income Under 25 years
COMPARE
Immigrants from Netherlands
Immigrants from Bahamas
Householder Income Under 25 years
Householder Income Under 25 years Comparison
Immigrants from Netherlands
Immigrants from Bahamas
$52,592
HOUSEHOLDER INCOME UNDER 25 YEARS
72.8/ 100
METRIC RATING
158th/ 347
METRIC RANK
$45,793
HOUSEHOLDER INCOME UNDER 25 YEARS
0.0/ 100
METRIC RATING
325th/ 347
METRIC RANK
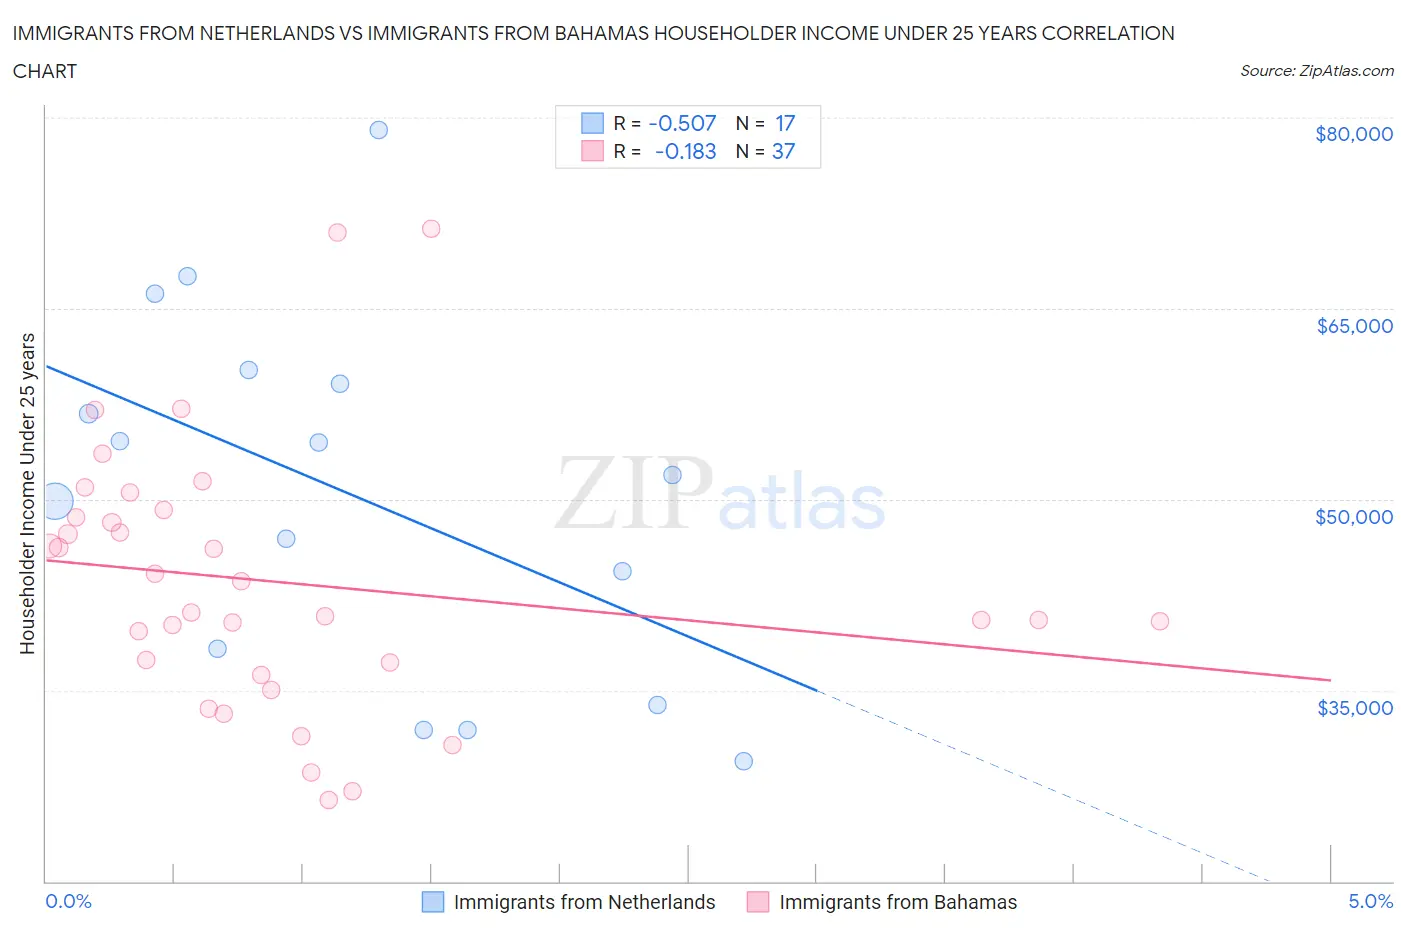
Immigrants from Netherlands vs Immigrants from Bahamas Householder Income Under 25 years Correlation Chart
The statistical analysis conducted on geographies consisting of 207,489,365 people shows a substantial negative correlation between the proportion of Immigrants from Netherlands and household income with householder under the age of 25 in the United States with a correlation coefficient (R) of -0.507 and weighted average of $52,592. Similarly, the statistical analysis conducted on geographies consisting of 97,494,664 people shows a poor negative correlation between the proportion of Immigrants from Bahamas and household income with householder under the age of 25 in the United States with a correlation coefficient (R) of -0.183 and weighted average of $45,793, a difference of 14.8%.
Householder Income Under 25 years Correlation Summary
| Measurement | Immigrants from Netherlands | Immigrants from Bahamas |
| Minimum | $29,438 | $26,418 |
| Maximum | $79,004 | $71,250 |
| Range | $49,567 | $44,832 |
| Mean | $50,356 | $43,510 |
| Median | $51,917 | $41,087 |
| Interquartile 25% (IQ1) | $36,019 | $36,692 |
| Interquartile 75% (IQ3) | $59,656 | $48,889 |
| Interquartile Range (IQR) | $23,637 | $12,196 |
| Standard Deviation (Sample) | $14,151 | $10,378 |
| Standard Deviation (Population) | $13,728 | $10,237 |
Similar Demographics by Householder Income Under 25 years
Demographics Similar to Immigrants from Netherlands by Householder Income Under 25 years
In terms of householder income under 25 years, the demographic groups most similar to Immigrants from Netherlands are Ghanaian ($52,594, a difference of 0.0%), Immigrants from Denmark ($52,612, a difference of 0.040%), Immigrants from Nepal ($52,611, a difference of 0.040%), Immigrants from the Azores ($52,621, a difference of 0.060%), and Central American ($52,626, a difference of 0.070%).
| Demographics | Rating | Rank | Householder Income Under 25 years |
| Immigrants | Scotland | 75.0 /100 | #151 | Good $52,638 |
| Trinidadians and Tobagonians | 74.6 /100 | #152 | Good $52,631 |
| Central Americans | 74.4 /100 | #153 | Good $52,626 |
| Immigrants | Azores | 74.2 /100 | #154 | Good $52,621 |
| Immigrants | Denmark | 73.8 /100 | #155 | Good $52,612 |
| Immigrants | Nepal | 73.7 /100 | #156 | Good $52,611 |
| Ghanaians | 72.9 /100 | #157 | Good $52,594 |
| Immigrants | Netherlands | 72.8 /100 | #158 | Good $52,592 |
| Mongolians | 70.2 /100 | #159 | Good $52,540 |
| Immigrants | Turkey | 68.3 /100 | #160 | Good $52,503 |
| Uruguayans | 66.2 /100 | #161 | Good $52,465 |
| Immigrants | Cambodia | 65.4 /100 | #162 | Good $52,450 |
| Immigrants | Chile | 64.8 /100 | #163 | Good $52,440 |
| Immigrants | Trinidad and Tobago | 64.7 /100 | #164 | Good $52,437 |
| Poles | 63.0 /100 | #165 | Good $52,407 |
Demographics Similar to Immigrants from Bahamas by Householder Income Under 25 years
In terms of householder income under 25 years, the demographic groups most similar to Immigrants from Bahamas are Dutch West Indian ($45,816, a difference of 0.050%), Osage ($45,764, a difference of 0.060%), Bahamian ($45,743, a difference of 0.11%), German Russian ($45,673, a difference of 0.26%), and Seminole ($45,649, a difference of 0.32%).
| Demographics | Rating | Rank | Householder Income Under 25 years |
| Spanish Americans | 0.0 /100 | #318 | Tragic $46,913 |
| Africans | 0.0 /100 | #319 | Tragic $46,838 |
| Immigrants | Sudan | 0.0 /100 | #320 | Tragic $46,791 |
| Potawatomi | 0.0 /100 | #321 | Tragic $46,462 |
| Sioux | 0.0 /100 | #322 | Tragic $46,417 |
| Immigrants | Saudi Arabia | 0.0 /100 | #323 | Tragic $46,187 |
| Dutch West Indians | 0.0 /100 | #324 | Tragic $45,816 |
| Immigrants | Bahamas | 0.0 /100 | #325 | Tragic $45,793 |
| Osage | 0.0 /100 | #326 | Tragic $45,764 |
| Bahamians | 0.0 /100 | #327 | Tragic $45,743 |
| German Russians | 0.0 /100 | #328 | Tragic $45,673 |
| Seminole | 0.0 /100 | #329 | Tragic $45,649 |
| Indonesians | 0.0 /100 | #330 | Tragic $45,566 |
| Immigrants | Zaire | 0.0 /100 | #331 | Tragic $45,529 |
| Choctaw | 0.0 /100 | #332 | Tragic $45,450 |