Immigrants from Netherlands vs Immigrants from Zaire Householder Income Under 25 years
COMPARE
Immigrants from Netherlands
Immigrants from Zaire
Householder Income Under 25 years
Householder Income Under 25 years Comparison
Immigrants from Netherlands
Immigrants from Zaire
$52,592
HOUSEHOLDER INCOME UNDER 25 YEARS
72.8/ 100
METRIC RATING
158th/ 347
METRIC RANK
$45,529
HOUSEHOLDER INCOME UNDER 25 YEARS
0.0/ 100
METRIC RATING
331st/ 347
METRIC RANK
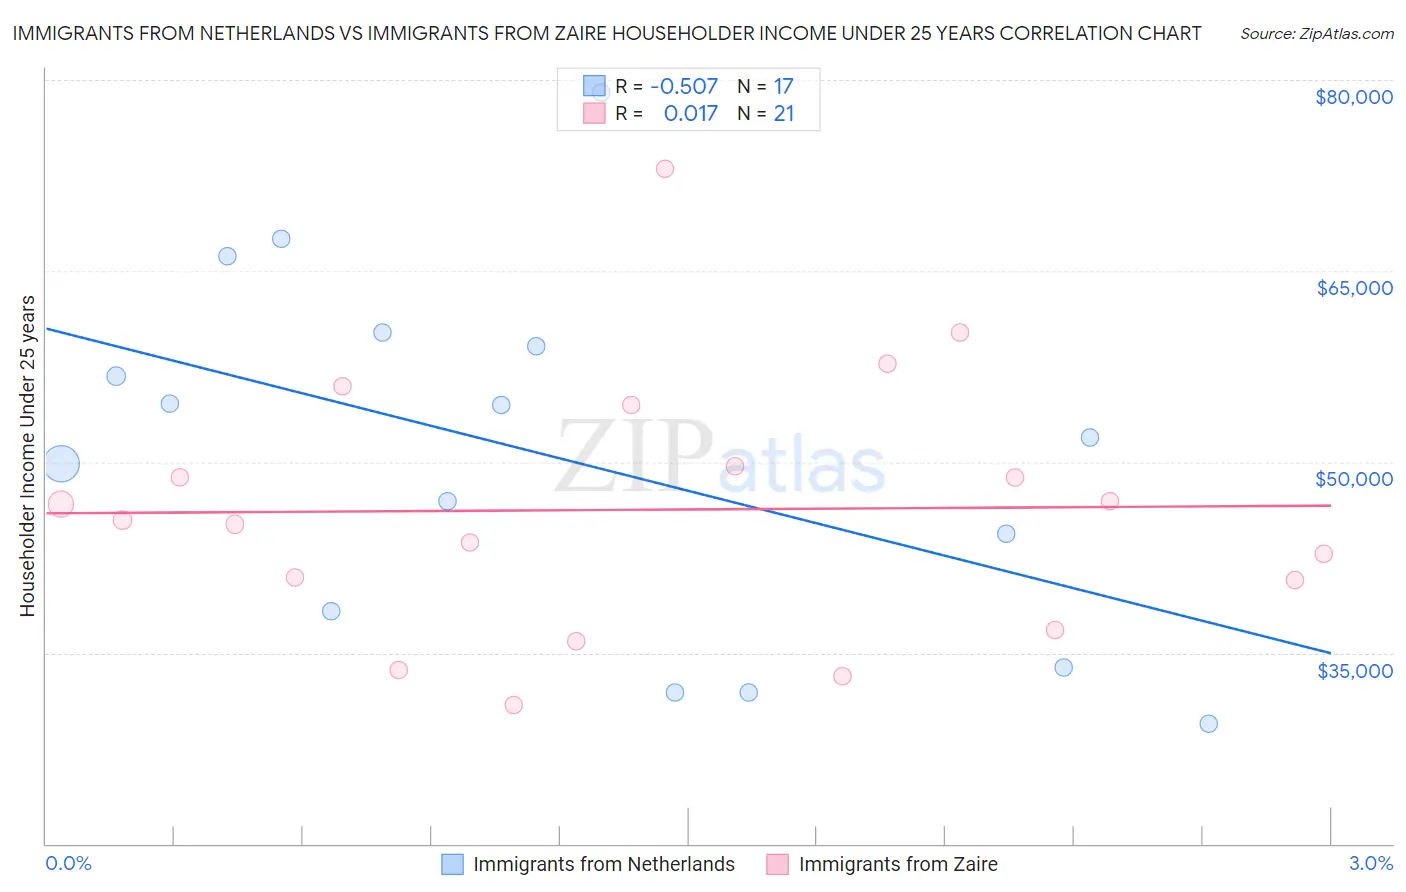
Immigrants from Netherlands vs Immigrants from Zaire Householder Income Under 25 years Correlation Chart
The statistical analysis conducted on geographies consisting of 207,489,365 people shows a substantial negative correlation between the proportion of Immigrants from Netherlands and household income with householder under the age of 25 in the United States with a correlation coefficient (R) of -0.507 and weighted average of $52,592. Similarly, the statistical analysis conducted on geographies consisting of 101,704,026 people shows no correlation between the proportion of Immigrants from Zaire and household income with householder under the age of 25 in the United States with a correlation coefficient (R) of 0.017 and weighted average of $45,529, a difference of 15.5%.
Householder Income Under 25 years Correlation Summary
| Measurement | Immigrants from Netherlands | Immigrants from Zaire |
| Minimum | $29,438 | $30,877 |
| Maximum | $79,004 | $73,045 |
| Range | $49,567 | $42,168 |
| Mean | $50,356 | $46,246 |
| Median | $51,917 | $45,465 |
| Interquartile 25% (IQ1) | $36,019 | $38,741 |
| Interquartile 75% (IQ3) | $59,656 | $52,065 |
| Interquartile Range (IQR) | $23,637 | $13,324 |
| Standard Deviation (Sample) | $14,151 | $10,181 |
| Standard Deviation (Population) | $13,728 | $9,936 |
Similar Demographics by Householder Income Under 25 years
Demographics Similar to Immigrants from Netherlands by Householder Income Under 25 years
In terms of householder income under 25 years, the demographic groups most similar to Immigrants from Netherlands are Ghanaian ($52,594, a difference of 0.0%), Immigrants from Denmark ($52,612, a difference of 0.040%), Immigrants from Nepal ($52,611, a difference of 0.040%), Immigrants from the Azores ($52,621, a difference of 0.060%), and Central American ($52,626, a difference of 0.070%).
| Demographics | Rating | Rank | Householder Income Under 25 years |
| Immigrants | Scotland | 75.0 /100 | #151 | Good $52,638 |
| Trinidadians and Tobagonians | 74.6 /100 | #152 | Good $52,631 |
| Central Americans | 74.4 /100 | #153 | Good $52,626 |
| Immigrants | Azores | 74.2 /100 | #154 | Good $52,621 |
| Immigrants | Denmark | 73.8 /100 | #155 | Good $52,612 |
| Immigrants | Nepal | 73.7 /100 | #156 | Good $52,611 |
| Ghanaians | 72.9 /100 | #157 | Good $52,594 |
| Immigrants | Netherlands | 72.8 /100 | #158 | Good $52,592 |
| Mongolians | 70.2 /100 | #159 | Good $52,540 |
| Immigrants | Turkey | 68.3 /100 | #160 | Good $52,503 |
| Uruguayans | 66.2 /100 | #161 | Good $52,465 |
| Immigrants | Cambodia | 65.4 /100 | #162 | Good $52,450 |
| Immigrants | Chile | 64.8 /100 | #163 | Good $52,440 |
| Immigrants | Trinidad and Tobago | 64.7 /100 | #164 | Good $52,437 |
| Poles | 63.0 /100 | #165 | Good $52,407 |
Demographics Similar to Immigrants from Zaire by Householder Income Under 25 years
In terms of householder income under 25 years, the demographic groups most similar to Immigrants from Zaire are Indonesian ($45,566, a difference of 0.080%), Choctaw ($45,450, a difference of 0.17%), Seminole ($45,649, a difference of 0.26%), German Russian ($45,673, a difference of 0.32%), and Creek ($45,371, a difference of 0.35%).
| Demographics | Rating | Rank | Householder Income Under 25 years |
| Dutch West Indians | 0.0 /100 | #324 | Tragic $45,816 |
| Immigrants | Bahamas | 0.0 /100 | #325 | Tragic $45,793 |
| Osage | 0.0 /100 | #326 | Tragic $45,764 |
| Bahamians | 0.0 /100 | #327 | Tragic $45,743 |
| German Russians | 0.0 /100 | #328 | Tragic $45,673 |
| Seminole | 0.0 /100 | #329 | Tragic $45,649 |
| Indonesians | 0.0 /100 | #330 | Tragic $45,566 |
| Immigrants | Zaire | 0.0 /100 | #331 | Tragic $45,529 |
| Choctaw | 0.0 /100 | #332 | Tragic $45,450 |
| Creek | 0.0 /100 | #333 | Tragic $45,371 |
| Cajuns | 0.0 /100 | #334 | Tragic $45,338 |
| Cheyenne | 0.0 /100 | #335 | Tragic $45,275 |
| Tohono O'odham | 0.0 /100 | #336 | Tragic $45,248 |
| Pueblo | 0.0 /100 | #337 | Tragic $45,018 |
| Chickasaw | 0.0 /100 | #338 | Tragic $44,763 |