Immigrants from Nepal vs Immigrants from Germany Doctorate Degree
COMPARE
Immigrants from Nepal
Immigrants from Germany
Doctorate Degree
Doctorate Degree Comparison
Immigrants from Nepal
Immigrants from Germany
2.2%
DOCTORATE DEGREE
99.3/ 100
METRIC RATING
88th/ 347
METRIC RANK
2.1%
DOCTORATE DEGREE
97.3/ 100
METRIC RATING
108th/ 347
METRIC RANK
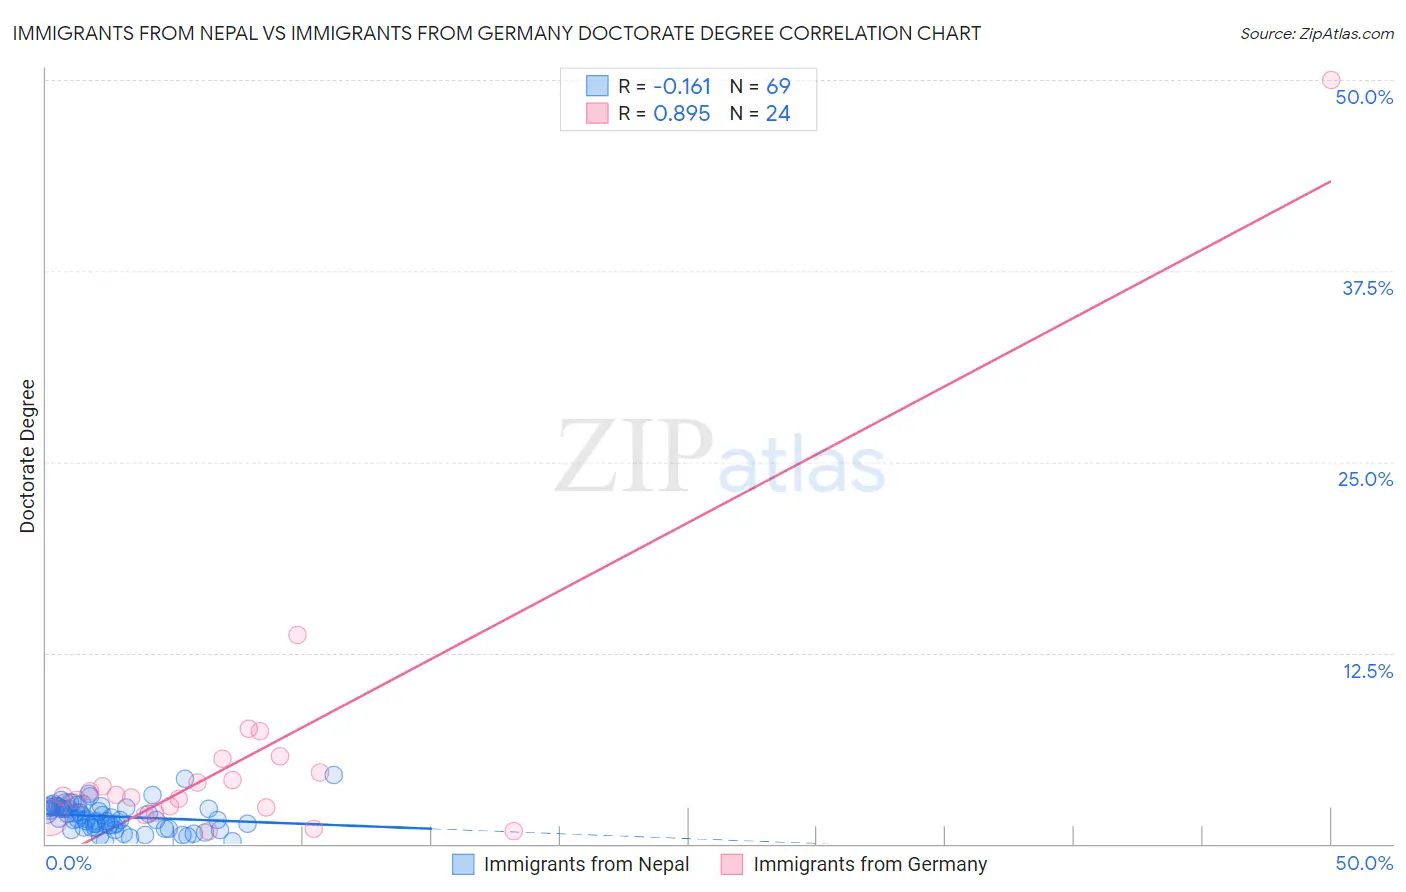
Immigrants from Nepal vs Immigrants from Germany Doctorate Degree Correlation Chart
The statistical analysis conducted on geographies consisting of 186,268,809 people shows a poor negative correlation between the proportion of Immigrants from Nepal and percentage of population with at least doctorate degree education in the United States with a correlation coefficient (R) of -0.161 and weighted average of 2.2%. Similarly, the statistical analysis conducted on geographies consisting of 457,324,098 people shows a very strong positive correlation between the proportion of Immigrants from Germany and percentage of population with at least doctorate degree education in the United States with a correlation coefficient (R) of 0.895 and weighted average of 2.1%, a difference of 4.7%.
Doctorate Degree Correlation Summary
| Measurement | Immigrants from Nepal | Immigrants from Germany |
| Minimum | 0.17% | 0.81% |
| Maximum | 4.5% | 50.0% |
| Range | 4.3% | 49.2% |
| Mean | 1.8% | 5.8% |
| Median | 1.7% | 3.1% |
| Interquartile 25% (IQ1) | 1.1% | 2.2% |
| Interquartile 75% (IQ3) | 2.4% | 5.1% |
| Interquartile Range (IQR) | 1.3% | 2.9% |
| Standard Deviation (Sample) | 0.89% | 9.8% |
| Standard Deviation (Population) | 0.88% | 9.6% |
Demographics Similar to Immigrants from Nepal and Immigrants from Germany by Doctorate Degree
In terms of doctorate degree, the demographic groups most similar to Immigrants from Nepal are British (2.2%, a difference of 0.44%), Immigrants from Scotland (2.2%, a difference of 0.45%), Immigrants from Sudan (2.2%, a difference of 0.93%), Chilean (2.2%, a difference of 1.2%), and Alsatian (2.1%, a difference of 1.4%). Similarly, the demographic groups most similar to Immigrants from Germany are European (2.1%, a difference of 0.22%), Sudanese (2.1%, a difference of 0.62%), Arab (2.1%, a difference of 0.71%), Austrian (2.1%, a difference of 1.1%), and Romanian (2.1%, a difference of 1.2%).
| Demographics | Rating | Rank | Doctorate Degree |
| Immigrants | Nepal | 99.3 /100 | #88 | Exceptional 2.2% |
| British | 99.3 /100 | #89 | Exceptional 2.2% |
| Immigrants | Scotland | 99.2 /100 | #90 | Exceptional 2.2% |
| Immigrants | Sudan | 99.1 /100 | #91 | Exceptional 2.2% |
| Chileans | 99.1 /100 | #92 | Exceptional 2.2% |
| Alsatians | 99.0 /100 | #93 | Exceptional 2.1% |
| Greeks | 98.8 /100 | #94 | Exceptional 2.1% |
| Immigrants | Romania | 98.7 /100 | #95 | Exceptional 2.1% |
| Immigrants | Northern Africa | 98.4 /100 | #96 | Exceptional 2.1% |
| Immigrants | Eritrea | 98.4 /100 | #97 | Exceptional 2.1% |
| Armenians | 98.3 /100 | #98 | Exceptional 2.1% |
| Immigrants | Egypt | 98.2 /100 | #99 | Exceptional 2.1% |
| Immigrants | Eastern Europe | 98.2 /100 | #100 | Exceptional 2.1% |
| Immigrants | Eastern Africa | 98.2 /100 | #101 | Exceptional 2.1% |
| Immigrants | Chile | 98.1 /100 | #102 | Exceptional 2.1% |
| Romanians | 98.1 /100 | #103 | Exceptional 2.1% |
| Austrians | 98.0 /100 | #104 | Exceptional 2.1% |
| Arabs | 97.8 /100 | #105 | Exceptional 2.1% |
| Sudanese | 97.7 /100 | #106 | Exceptional 2.1% |
| Europeans | 97.5 /100 | #107 | Exceptional 2.1% |
| Immigrants | Germany | 97.3 /100 | #108 | Exceptional 2.1% |