Immigrants from Micronesia vs Ethiopian Median Male Earnings
COMPARE
Immigrants from Micronesia
Ethiopian
Median Male Earnings
Median Male Earnings Comparison
Immigrants from Micronesia
Ethiopians
$47,177
MEDIAN MALE EARNINGS
0.1/ 100
METRIC RATING
298th/ 347
METRIC RANK
$56,243
MEDIAN MALE EARNINGS
84.8/ 100
METRIC RATING
142nd/ 347
METRIC RANK
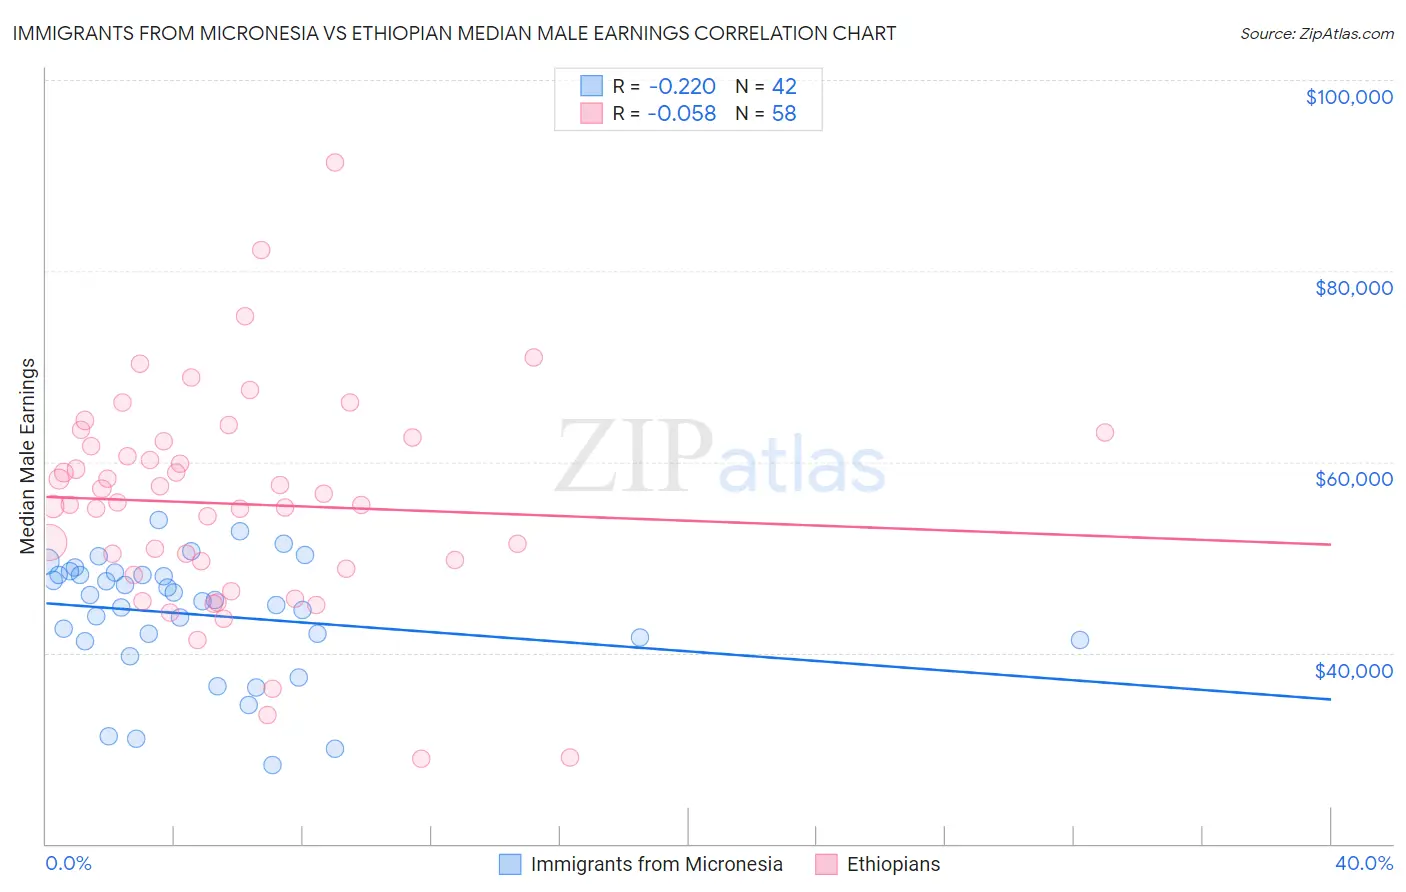
Immigrants from Micronesia vs Ethiopian Median Male Earnings Correlation Chart
The statistical analysis conducted on geographies consisting of 61,605,252 people shows a weak negative correlation between the proportion of Immigrants from Micronesia and median male earnings in the United States with a correlation coefficient (R) of -0.220 and weighted average of $47,177. Similarly, the statistical analysis conducted on geographies consisting of 223,246,505 people shows a slight negative correlation between the proportion of Ethiopians and median male earnings in the United States with a correlation coefficient (R) of -0.058 and weighted average of $56,243, a difference of 19.2%.
Median Male Earnings Correlation Summary
| Measurement | Immigrants from Micronesia | Ethiopian |
| Minimum | $28,299 | $28,882 |
| Maximum | $53,866 | $91,333 |
| Range | $25,567 | $62,451 |
| Mean | $43,968 | $55,598 |
| Median | $45,525 | $55,634 |
| Interquartile 25% (IQ1) | $41,333 | $48,793 |
| Interquartile 75% (IQ3) | $48,203 | $62,132 |
| Interquartile Range (IQR) | $6,870 | $13,339 |
| Standard Deviation (Sample) | $6,332 | $11,505 |
| Standard Deviation (Population) | $6,257 | $11,405 |
Similar Demographics by Median Male Earnings
Demographics Similar to Immigrants from Micronesia by Median Male Earnings
In terms of median male earnings, the demographic groups most similar to Immigrants from Micronesia are Dominican ($47,204, a difference of 0.060%), Inupiat ($47,281, a difference of 0.22%), Immigrants from Zaire ($47,070, a difference of 0.23%), U.S. Virgin Islander ($47,066, a difference of 0.23%), and Immigrants from Latin America ($46,941, a difference of 0.50%).
| Demographics | Rating | Rank | Median Male Earnings |
| Choctaw | 0.1 /100 | #291 | Tragic $47,729 |
| Immigrants | Dominica | 0.1 /100 | #292 | Tragic $47,651 |
| Indonesians | 0.1 /100 | #293 | Tragic $47,503 |
| Immigrants | Nicaragua | 0.1 /100 | #294 | Tragic $47,482 |
| Central American Indians | 0.1 /100 | #295 | Tragic $47,433 |
| Inupiat | 0.1 /100 | #296 | Tragic $47,281 |
| Dominicans | 0.1 /100 | #297 | Tragic $47,204 |
| Immigrants | Micronesia | 0.1 /100 | #298 | Tragic $47,177 |
| Immigrants | Zaire | 0.1 /100 | #299 | Tragic $47,070 |
| U.S. Virgin Islanders | 0.1 /100 | #300 | Tragic $47,066 |
| Immigrants | Latin America | 0.1 /100 | #301 | Tragic $46,941 |
| Seminole | 0.1 /100 | #302 | Tragic $46,783 |
| Yaqui | 0.1 /100 | #303 | Tragic $46,777 |
| Bangladeshis | 0.1 /100 | #304 | Tragic $46,744 |
| Guatemalans | 0.0 /100 | #305 | Tragic $46,736 |
Demographics Similar to Ethiopians by Median Male Earnings
In terms of median male earnings, the demographic groups most similar to Ethiopians are Danish ($56,246, a difference of 0.0%), Zimbabwean ($56,302, a difference of 0.10%), Luxembourger ($56,300, a difference of 0.10%), Slovak ($56,306, a difference of 0.11%), and Sri Lankan ($56,136, a difference of 0.19%).
| Demographics | Rating | Rank | Median Male Earnings |
| Irish | 87.4 /100 | #135 | Excellent $56,464 |
| Immigrants | Saudi Arabia | 87.2 /100 | #136 | Excellent $56,452 |
| Slavs | 86.5 /100 | #137 | Excellent $56,390 |
| Slovaks | 85.5 /100 | #138 | Excellent $56,306 |
| Zimbabweans | 85.5 /100 | #139 | Excellent $56,302 |
| Luxembourgers | 85.5 /100 | #140 | Excellent $56,300 |
| Danes | 84.8 /100 | #141 | Excellent $56,246 |
| Ethiopians | 84.8 /100 | #142 | Excellent $56,243 |
| Sri Lankans | 83.4 /100 | #143 | Excellent $56,136 |
| Immigrants | Uganda | 82.4 /100 | #144 | Excellent $56,064 |
| Norwegians | 80.9 /100 | #145 | Excellent $55,965 |
| Immigrants | Chile | 80.7 /100 | #146 | Excellent $55,954 |
| Immigrants | Philippines | 78.4 /100 | #147 | Good $55,809 |
| Scottish | 78.2 /100 | #148 | Good $55,793 |
| English | 77.4 /100 | #149 | Good $55,747 |