Immigrants from Liberia vs West Indian Householder Income Ages 45 - 64 years
COMPARE
Immigrants from Liberia
West Indian
Householder Income Ages 45 - 64 years
Householder Income Ages 45 - 64 years Comparison
Immigrants from Liberia
West Indians
$87,739
HOUSEHOLDER INCOME AGES 45 - 64 YEARS
0.2/ 100
METRIC RATING
270th/ 347
METRIC RANK
$89,906
HOUSEHOLDER INCOME AGES 45 - 64 YEARS
0.5/ 100
METRIC RATING
255th/ 347
METRIC RANK
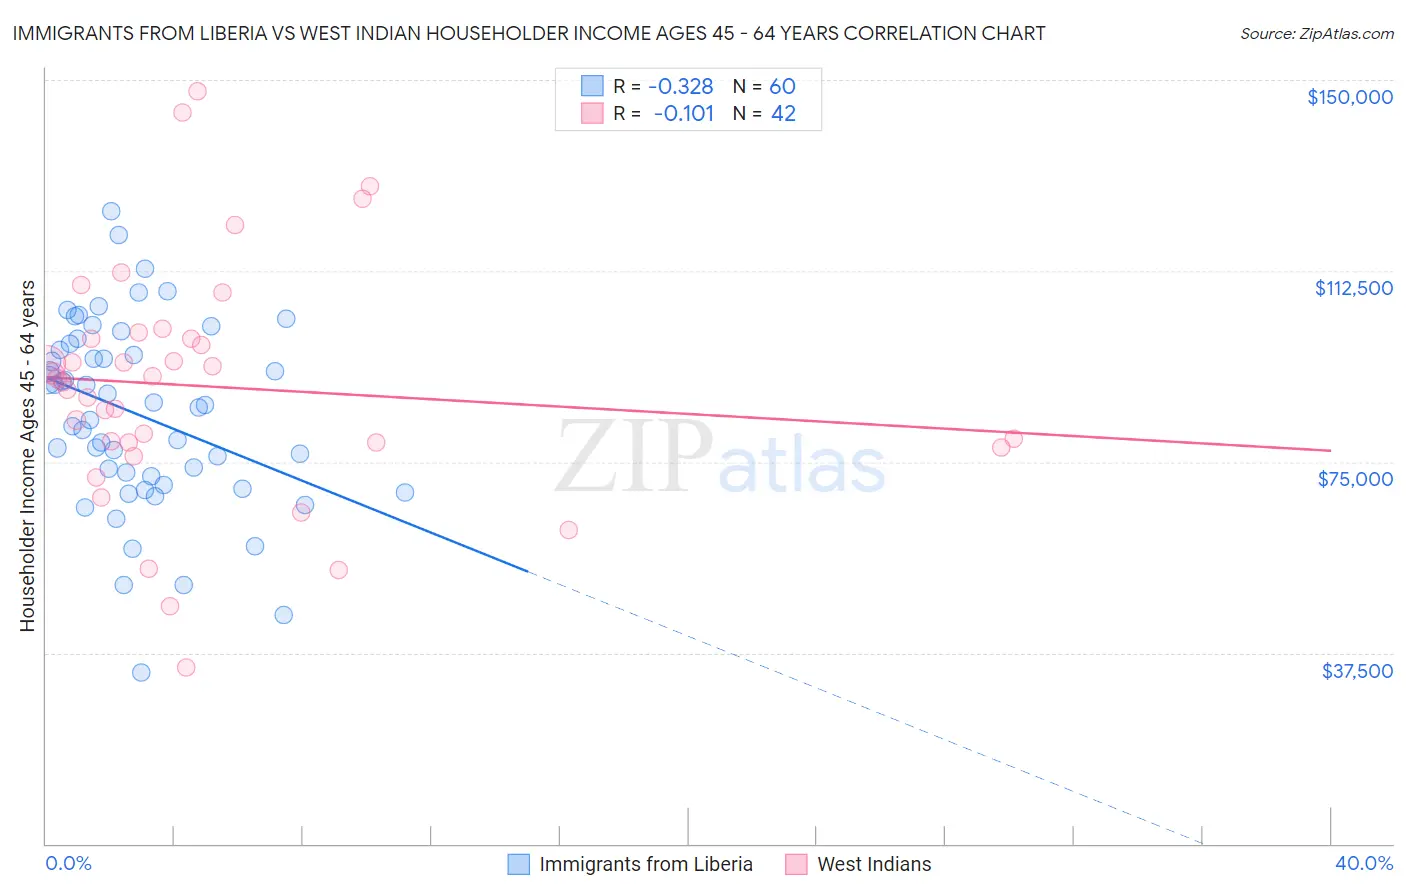
Immigrants from Liberia vs West Indian Householder Income Ages 45 - 64 years Correlation Chart
The statistical analysis conducted on geographies consisting of 135,189,052 people shows a mild negative correlation between the proportion of Immigrants from Liberia and household income with householder between the ages 45 and 64 in the United States with a correlation coefficient (R) of -0.328 and weighted average of $87,739. Similarly, the statistical analysis conducted on geographies consisting of 253,646,357 people shows a poor negative correlation between the proportion of West Indians and household income with householder between the ages 45 and 64 in the United States with a correlation coefficient (R) of -0.101 and weighted average of $89,906, a difference of 2.5%.
Householder Income Ages 45 - 64 years Correlation Summary
| Measurement | Immigrants from Liberia | West Indian |
| Minimum | $33,597 | $34,699 |
| Maximum | $124,313 | $147,760 |
| Range | $90,716 | $113,061 |
| Mean | $84,202 | $89,808 |
| Median | $85,955 | $91,034 |
| Interquartile 25% (IQ1) | $71,300 | $78,920 |
| Interquartile 75% (IQ3) | $97,673 | $99,241 |
| Interquartile Range (IQR) | $26,373 | $20,321 |
| Standard Deviation (Sample) | $18,447 | $23,506 |
| Standard Deviation (Population) | $18,293 | $23,224 |
Demographics Similar to Immigrants from Liberia and West Indians by Householder Income Ages 45 - 64 years
In terms of householder income ages 45 - 64 years, the demographic groups most similar to Immigrants from Liberia are Guatemalan ($87,705, a difference of 0.040%), Spanish American ($87,836, a difference of 0.11%), Immigrants from Micronesia ($87,864, a difference of 0.14%), Cape Verdean ($87,580, a difference of 0.18%), and Hmong ($88,115, a difference of 0.43%). Similarly, the demographic groups most similar to West Indians are French American Indian ($89,811, a difference of 0.11%), Immigrants from Guyana ($90,186, a difference of 0.31%), Barbadian ($90,266, a difference of 0.40%), German Russian ($89,398, a difference of 0.57%), and Immigrants from Barbados ($89,394, a difference of 0.57%).
| Demographics | Rating | Rank | Householder Income Ages 45 - 64 years |
| Marshallese | 0.7 /100 | #252 | Tragic $90,455 |
| Barbadians | 0.6 /100 | #253 | Tragic $90,266 |
| Immigrants | Guyana | 0.6 /100 | #254 | Tragic $90,186 |
| West Indians | 0.5 /100 | #255 | Tragic $89,906 |
| French American Indians | 0.5 /100 | #256 | Tragic $89,811 |
| German Russians | 0.4 /100 | #257 | Tragic $89,398 |
| Immigrants | Barbados | 0.4 /100 | #258 | Tragic $89,394 |
| Immigrants | Nicaragua | 0.4 /100 | #259 | Tragic $89,108 |
| Liberians | 0.3 /100 | #260 | Tragic $88,929 |
| Belizeans | 0.3 /100 | #261 | Tragic $88,684 |
| Somalis | 0.3 /100 | #262 | Tragic $88,600 |
| Immigrants | Senegal | 0.3 /100 | #263 | Tragic $88,421 |
| Osage | 0.3 /100 | #264 | Tragic $88,390 |
| Jamaicans | 0.2 /100 | #265 | Tragic $88,327 |
| Immigrants | West Indies | 0.2 /100 | #266 | Tragic $88,164 |
| Hmong | 0.2 /100 | #267 | Tragic $88,115 |
| Immigrants | Micronesia | 0.2 /100 | #268 | Tragic $87,864 |
| Spanish Americans | 0.2 /100 | #269 | Tragic $87,836 |
| Immigrants | Liberia | 0.2 /100 | #270 | Tragic $87,739 |
| Guatemalans | 0.2 /100 | #271 | Tragic $87,705 |
| Cape Verdeans | 0.2 /100 | #272 | Tragic $87,580 |