Immigrants from Ecuador vs West Indian Householder Income Ages 45 - 64 years
COMPARE
Immigrants from Ecuador
West Indian
Householder Income Ages 45 - 64 years
Householder Income Ages 45 - 64 years Comparison
Immigrants from Ecuador
West Indians
$91,462
HOUSEHOLDER INCOME AGES 45 - 64 YEARS
1.2/ 100
METRIC RATING
239th/ 347
METRIC RANK
$89,906
HOUSEHOLDER INCOME AGES 45 - 64 YEARS
0.5/ 100
METRIC RATING
255th/ 347
METRIC RANK
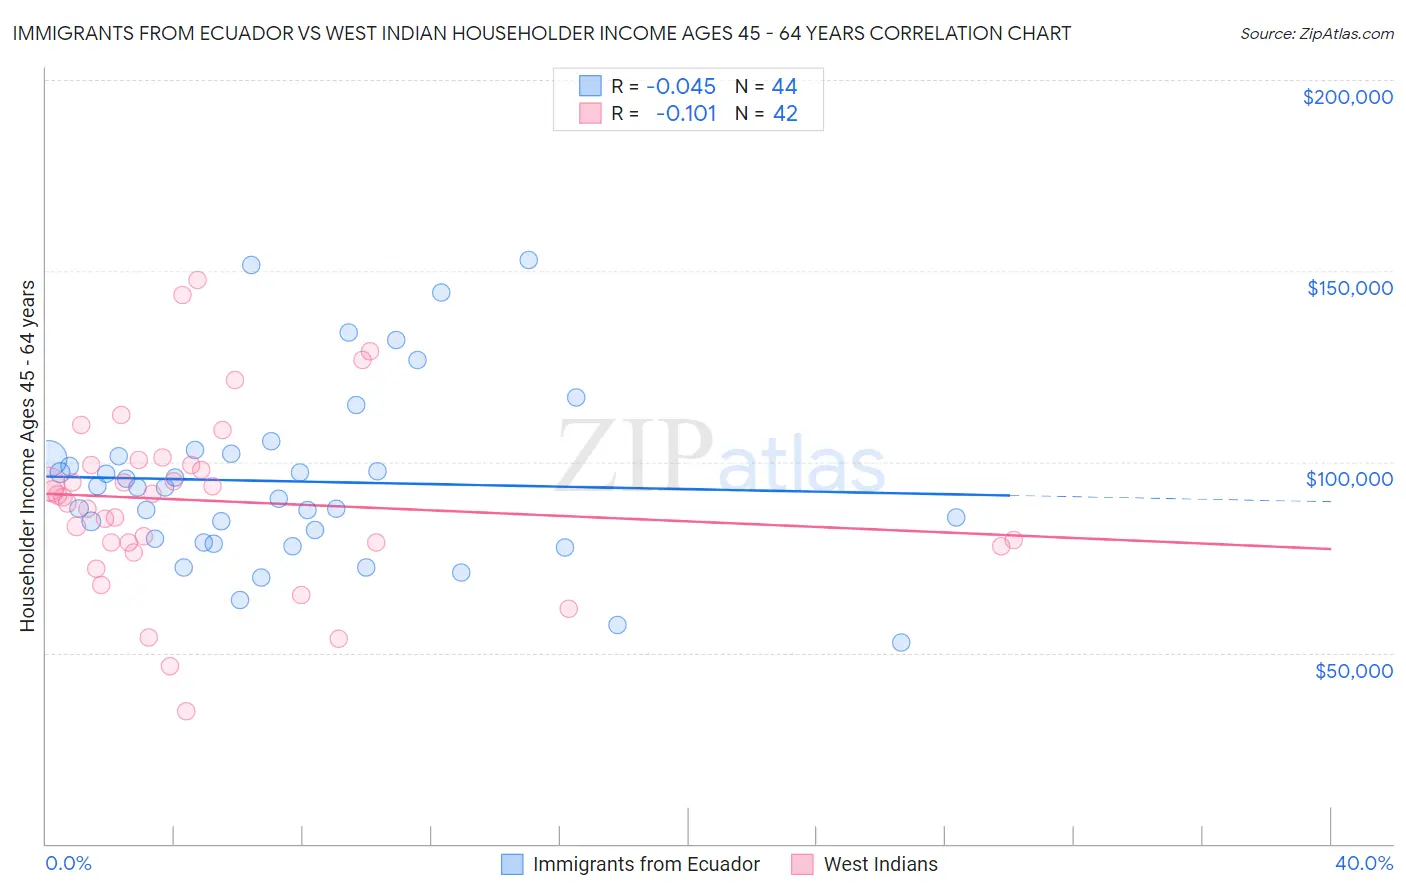
Immigrants from Ecuador vs West Indian Householder Income Ages 45 - 64 years Correlation Chart
The statistical analysis conducted on geographies consisting of 270,702,747 people shows no correlation between the proportion of Immigrants from Ecuador and household income with householder between the ages 45 and 64 in the United States with a correlation coefficient (R) of -0.045 and weighted average of $91,462. Similarly, the statistical analysis conducted on geographies consisting of 253,646,357 people shows a poor negative correlation between the proportion of West Indians and household income with householder between the ages 45 and 64 in the United States with a correlation coefficient (R) of -0.101 and weighted average of $89,906, a difference of 1.7%.
Householder Income Ages 45 - 64 years Correlation Summary
| Measurement | Immigrants from Ecuador | West Indian |
| Minimum | $52,679 | $34,699 |
| Maximum | $152,835 | $147,760 |
| Range | $100,156 | $113,061 |
| Mean | $94,870 | $89,808 |
| Median | $93,268 | $91,034 |
| Interquartile 25% (IQ1) | $79,452 | $78,920 |
| Interquartile 75% (IQ3) | $101,758 | $99,241 |
| Interquartile Range (IQR) | $22,306 | $20,321 |
| Standard Deviation (Sample) | $22,936 | $23,506 |
| Standard Deviation (Population) | $22,674 | $23,224 |
Demographics Similar to Immigrants from Ecuador and West Indians by Householder Income Ages 45 - 64 years
In terms of householder income ages 45 - 64 years, the demographic groups most similar to Immigrants from Ecuador are Immigrants from Burma/Myanmar ($91,385, a difference of 0.080%), Trinidadian and Tobagonian ($91,357, a difference of 0.12%), Inupiat ($91,355, a difference of 0.12%), Immigrants from Trinidad and Tobago ($91,347, a difference of 0.13%), and Immigrants from Middle Africa ($91,293, a difference of 0.19%). Similarly, the demographic groups most similar to West Indians are French American Indian ($89,811, a difference of 0.11%), Immigrants from Guyana ($90,186, a difference of 0.31%), Barbadian ($90,266, a difference of 0.40%), German Russian ($89,398, a difference of 0.57%), and Marshallese ($90,455, a difference of 0.61%).
| Demographics | Rating | Rank | Householder Income Ages 45 - 64 years |
| Immigrants | Bangladesh | 1.7 /100 | #237 | Tragic $92,208 |
| Pennsylvania Germans | 1.5 /100 | #238 | Tragic $91,956 |
| Immigrants | Ecuador | 1.2 /100 | #239 | Tragic $91,462 |
| Immigrants | Burma/Myanmar | 1.1 /100 | #240 | Tragic $91,385 |
| Trinidadians and Tobagonians | 1.1 /100 | #241 | Tragic $91,357 |
| Inupiat | 1.1 /100 | #242 | Tragic $91,355 |
| Immigrants | Trinidad and Tobago | 1.1 /100 | #243 | Tragic $91,347 |
| Immigrants | Middle Africa | 1.1 /100 | #244 | Tragic $91,293 |
| Guyanese | 0.9 /100 | #245 | Tragic $90,966 |
| Central Americans | 0.9 /100 | #246 | Tragic $90,951 |
| Alaskan Athabascans | 0.9 /100 | #247 | Tragic $90,951 |
| Immigrants | Laos | 0.9 /100 | #248 | Tragic $90,909 |
| Mexican American Indians | 0.8 /100 | #249 | Tragic $90,811 |
| Sub-Saharan Africans | 0.8 /100 | #250 | Tragic $90,691 |
| Americans | 0.7 /100 | #251 | Tragic $90,536 |
| Marshallese | 0.7 /100 | #252 | Tragic $90,455 |
| Barbadians | 0.6 /100 | #253 | Tragic $90,266 |
| Immigrants | Guyana | 0.6 /100 | #254 | Tragic $90,186 |
| West Indians | 0.5 /100 | #255 | Tragic $89,906 |
| French American Indians | 0.5 /100 | #256 | Tragic $89,811 |
| German Russians | 0.4 /100 | #257 | Tragic $89,398 |