Immigrants from Liberia vs Immigrants from Denmark Householder Income Ages 45 - 64 years
COMPARE
Immigrants from Liberia
Immigrants from Denmark
Householder Income Ages 45 - 64 years
Householder Income Ages 45 - 64 years Comparison
Immigrants from Liberia
Immigrants from Denmark
$87,739
HOUSEHOLDER INCOME AGES 45 - 64 YEARS
0.2/ 100
METRIC RATING
270th/ 347
METRIC RANK
$116,000
HOUSEHOLDER INCOME AGES 45 - 64 YEARS
100.0/ 100
METRIC RATING
34th/ 347
METRIC RANK
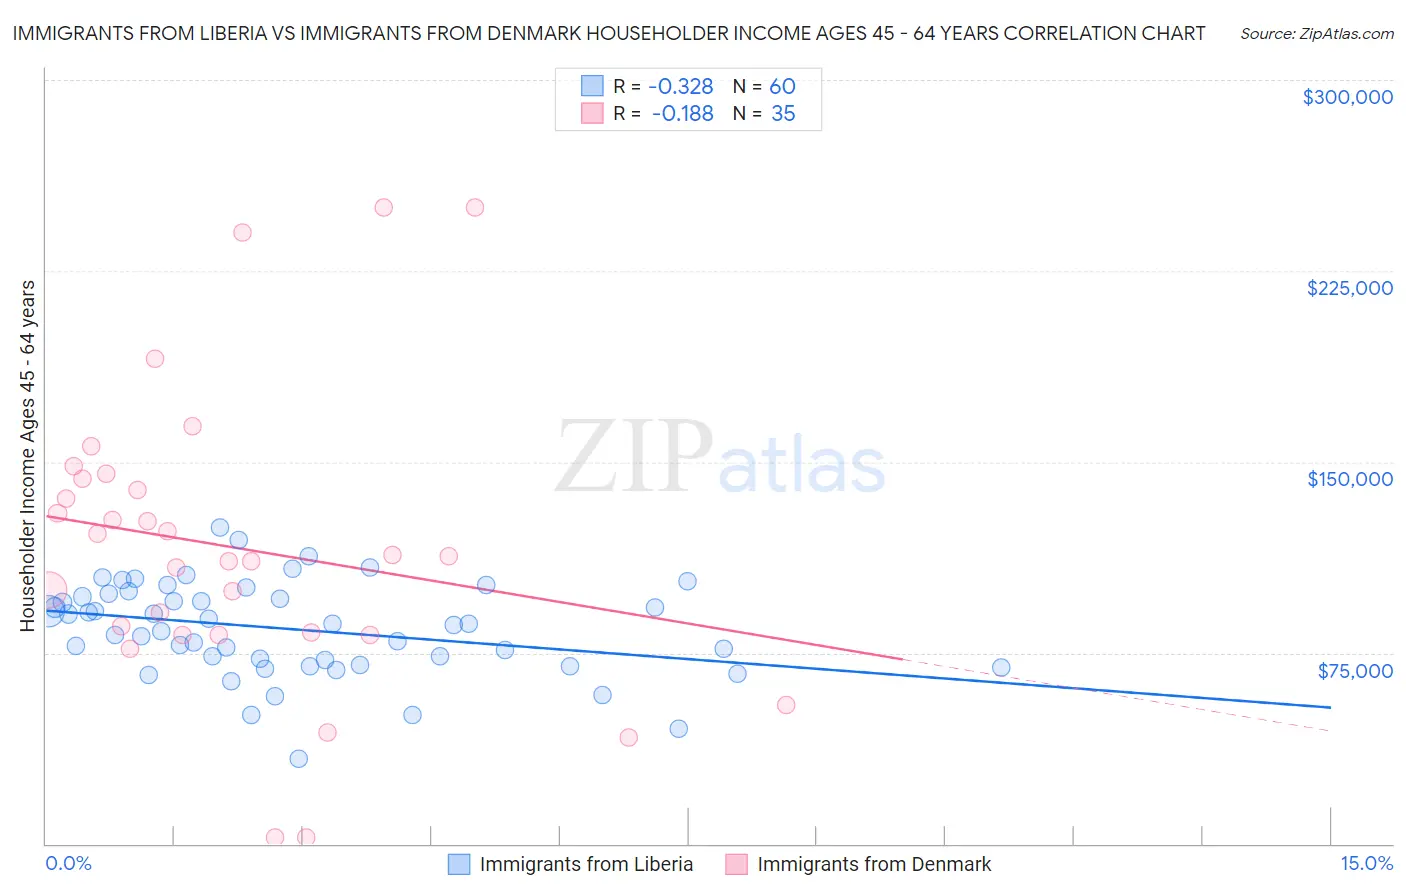
Immigrants from Liberia vs Immigrants from Denmark Householder Income Ages 45 - 64 years Correlation Chart
The statistical analysis conducted on geographies consisting of 135,189,052 people shows a mild negative correlation between the proportion of Immigrants from Liberia and household income with householder between the ages 45 and 64 in the United States with a correlation coefficient (R) of -0.328 and weighted average of $87,739. Similarly, the statistical analysis conducted on geographies consisting of 136,366,596 people shows a poor negative correlation between the proportion of Immigrants from Denmark and household income with householder between the ages 45 and 64 in the United States with a correlation coefficient (R) of -0.188 and weighted average of $116,000, a difference of 32.2%.
Householder Income Ages 45 - 64 years Correlation Summary
| Measurement | Immigrants from Liberia | Immigrants from Denmark |
| Minimum | $33,597 | $2,499 |
| Maximum | $124,313 | $250,001 |
| Range | $90,716 | $247,502 |
| Mean | $84,202 | $116,363 |
| Median | $85,955 | $112,813 |
| Interquartile 25% (IQ1) | $71,300 | $81,964 |
| Interquartile 75% (IQ3) | $97,673 | $143,426 |
| Interquartile Range (IQR) | $26,373 | $61,462 |
| Standard Deviation (Sample) | $18,447 | $57,800 |
| Standard Deviation (Population) | $18,293 | $56,968 |
Similar Demographics by Householder Income Ages 45 - 64 years
Demographics Similar to Immigrants from Liberia by Householder Income Ages 45 - 64 years
In terms of householder income ages 45 - 64 years, the demographic groups most similar to Immigrants from Liberia are Guatemalan ($87,705, a difference of 0.040%), Spanish American ($87,836, a difference of 0.11%), Immigrants from Micronesia ($87,864, a difference of 0.14%), Cape Verdean ($87,580, a difference of 0.18%), and Spanish American Indian ($87,561, a difference of 0.20%).
| Demographics | Rating | Rank | Householder Income Ages 45 - 64 years |
| Immigrants | Senegal | 0.3 /100 | #263 | Tragic $88,421 |
| Osage | 0.3 /100 | #264 | Tragic $88,390 |
| Jamaicans | 0.2 /100 | #265 | Tragic $88,327 |
| Immigrants | West Indies | 0.2 /100 | #266 | Tragic $88,164 |
| Hmong | 0.2 /100 | #267 | Tragic $88,115 |
| Immigrants | Micronesia | 0.2 /100 | #268 | Tragic $87,864 |
| Spanish Americans | 0.2 /100 | #269 | Tragic $87,836 |
| Immigrants | Liberia | 0.2 /100 | #270 | Tragic $87,739 |
| Guatemalans | 0.2 /100 | #271 | Tragic $87,705 |
| Cape Verdeans | 0.2 /100 | #272 | Tragic $87,580 |
| Spanish American Indians | 0.2 /100 | #273 | Tragic $87,561 |
| Iroquois | 0.1 /100 | #274 | Tragic $87,255 |
| Immigrants | Belize | 0.1 /100 | #275 | Tragic $87,229 |
| Immigrants | Latin America | 0.1 /100 | #276 | Tragic $87,219 |
| Cree | 0.1 /100 | #277 | Tragic $87,185 |
Demographics Similar to Immigrants from Denmark by Householder Income Ages 45 - 64 years
In terms of householder income ages 45 - 64 years, the demographic groups most similar to Immigrants from Denmark are Latvian ($115,957, a difference of 0.040%), Immigrants from Switzerland ($115,934, a difference of 0.060%), Chinese ($116,156, a difference of 0.13%), Russian ($116,328, a difference of 0.28%), and Immigrants from Asia ($116,566, a difference of 0.49%).
| Demographics | Rating | Rank | Householder Income Ages 45 - 64 years |
| Immigrants | Northern Europe | 100.0 /100 | #27 | Exceptional $117,930 |
| Turks | 100.0 /100 | #28 | Exceptional $117,814 |
| Bhutanese | 100.0 /100 | #29 | Exceptional $117,750 |
| Immigrants | Bolivia | 100.0 /100 | #30 | Exceptional $117,731 |
| Immigrants | Asia | 100.0 /100 | #31 | Exceptional $116,566 |
| Russians | 100.0 /100 | #32 | Exceptional $116,328 |
| Chinese | 100.0 /100 | #33 | Exceptional $116,156 |
| Immigrants | Denmark | 100.0 /100 | #34 | Exceptional $116,000 |
| Latvians | 100.0 /100 | #35 | Exceptional $115,957 |
| Immigrants | Switzerland | 100.0 /100 | #36 | Exceptional $115,934 |
| Maltese | 99.9 /100 | #37 | Exceptional $114,754 |
| Immigrants | Pakistan | 99.9 /100 | #38 | Exceptional $114,434 |
| Immigrants | Turkey | 99.9 /100 | #39 | Exceptional $114,407 |
| Cambodians | 99.9 /100 | #40 | Exceptional $114,342 |
| Immigrants | Lithuania | 99.9 /100 | #41 | Exceptional $114,336 |